Local Expertise | Practical Experience
How will global energy transit happen? Which steps are ahead? Which conclusions should investors make for medium- and long-term prospects? Answers to some of these questions give expert assessments that take into account the opposite effects on the development of events, and even indicate the key dates for changing the model of global energy.
Energy Timeline
In its study, Energy Transition Outlook 2018, a forecast to 2050, the DNV GL consulting firm (100+ worldwide branches) specializing in systemic investors’ forecasts for assessing the attractiveness of long-term investments in the energy sector, published a “timeline” of events regarding changes in global energy, see Fig. 1. Taking into account the influential reputation of experts from DNV GL, this forecast will have a direct impact on the behavior of investors.
The “green slope” in the diagram (Figure 1) demonstrates the share that the “non-fossil” energy sector will occupy in the overall structure. The first milestone date is 2014 – when coal began to lose its role in energy supply and its use in the world began to decline rapidly. Ahead are the peaks of oil consumption (2023) and natural gas, including shale (2034). In 2032 humanity will consume the maximum amount of primary energy, in 2035 – the peak of consumption of secondary forms (“final energy”). That is, in spite of the slowed growth of humanity, the whole civilization after 2035 will reduce energy consumption. World demand for primary energy is increasing (581 EJ in 2016) to a peak of 662 EJ in 2032, then gradually decreasing to approximately 586 EJ in 2050. The reason for it is the use of renewable energy along with energy saving and technological changes that reduce the overall consumption of energy per unit production in all spheres.
Global investment in RES in 2035 will exceed investment in fossil energy – both in new projects, both in support and in the modernization of existing ones.
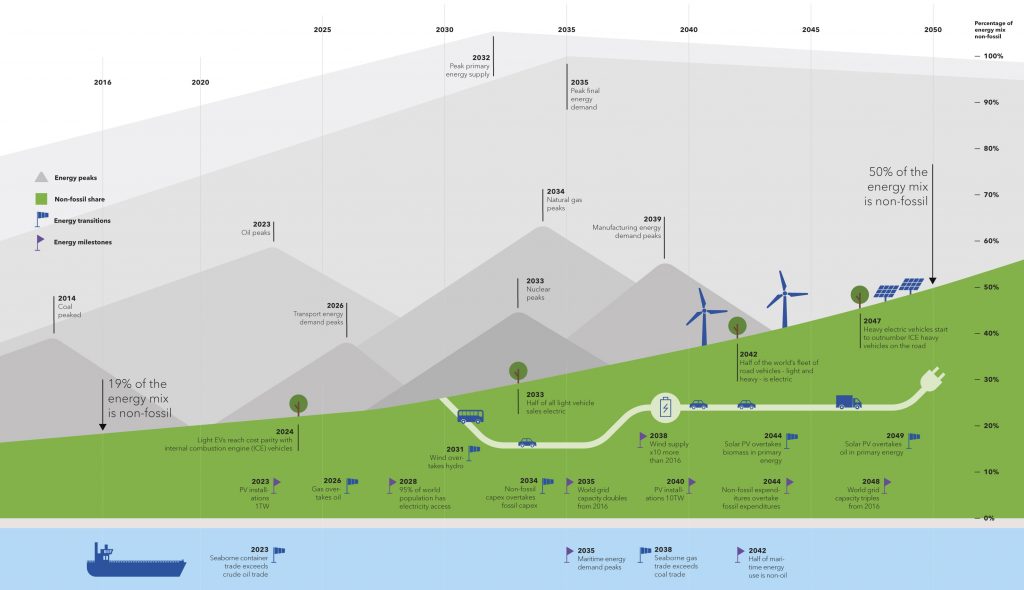
Fig. 1. Global changes in the energy model for 2014-2050 Source: DNV GL «Energy Transition Outlook 2018, a forecast to 2050».
In 2023, the total installed power of PV-modules will exceed 1 TW (currently – 465 GW). This is more optimistic than the BNEF’s New Energy Outlook 2018 scenario. According to DNV GL forecast in 2040, determined capacity of PV-installations in the world will be more than 10 TWh, which is expected to grow tenfold in 17 years. In 2044, global PV generation will exceed primary energy extraction from all types of biomass, including those extracted from the sea or as a result of the purification of fresh water from blue-green algae. Currently, bioenergy is leading in RES, but according to IEA calculations, in the medium term, the fastest increase from all types of RESs will have PV generation itself, see. Fig. 2, and this trend will continue to prevail. Between 2018-2023, total RES consumption will increase by almost 30%, which is 40% of global energy demand.
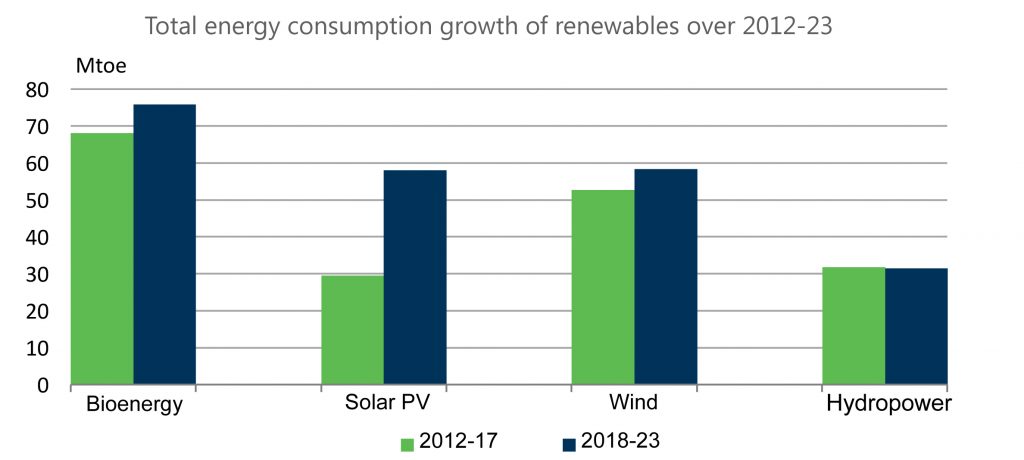
Fig. 2. Distribution of Primary Energy Consumption from RES, Mt.NE, 2012-2023 Source: IEA Renewables 2018. Market Analysis and Outlook from 2018 to 2023, October 2018.
In 2050, 50% of the world’s “energy basket” will be RES and other non-extraction sources of primary energy, see. Fig. 3, and 70% of the world’s electricity will be produced from the sun and wind.
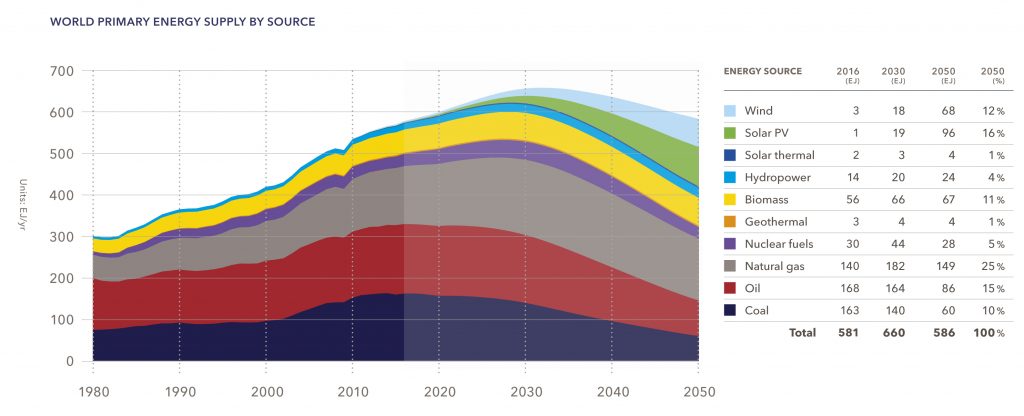
Fig. 3. World primary energy consumption, 1980-2050 Source: DNV GL «Energy Transition Outlook 2018, a forecast to 2050».
By 2050, electricity generation in the world will triple, see. Fig. 4, and in the total amount of energy consumed, electricity will be 45%. However, investments in electrification will be even faster than the PV sector itself, as expenditures will be required for the expansion and modernization of the infrastructure of common and distributed energy networks and the “digitalization” of control systems. This is especially true of low and medium voltage networks due to the accelerated development of distributed generation from variable reliance sources (VREs) that need to withstand higher peak loads than now. The largest factor in electricity consumption will be a massive transition to electricity for the generation of heat for heating and hot water. And among the sources of power generation specifically, will occupy a prominent place just PV-generation.
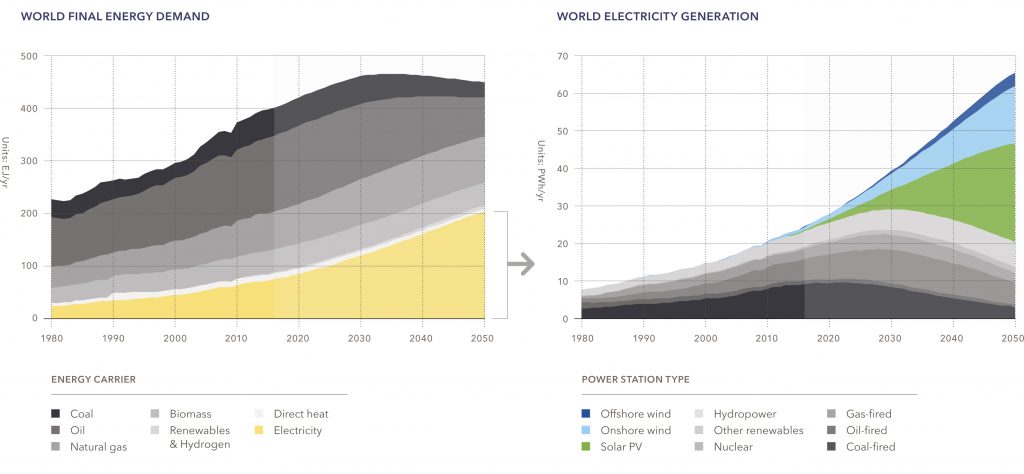
Fig. 4. World power generation and distribution of power generation by types of technologies, 1980-2050 Source: DNV GL «Energy Transition Outlook 2018, a forecast to 2050».
The share of investments in RES and in the development of networks compared with global energy expenditures will increase from 17% in 2016 to 47% in 2050, fossil sources in the total primary energy consumption will drop from current positions of 81% to 50% in 2050. Global annual energy expenditures will increase by 33% from $ 4.5 trillion in 2016 to $ 6.0 trillion. in 2050. The total costs of fossil sources (capital and current) will be reduced from $ 3.4 trillion. in 2016 to $ 2.1 trillion. in 2050
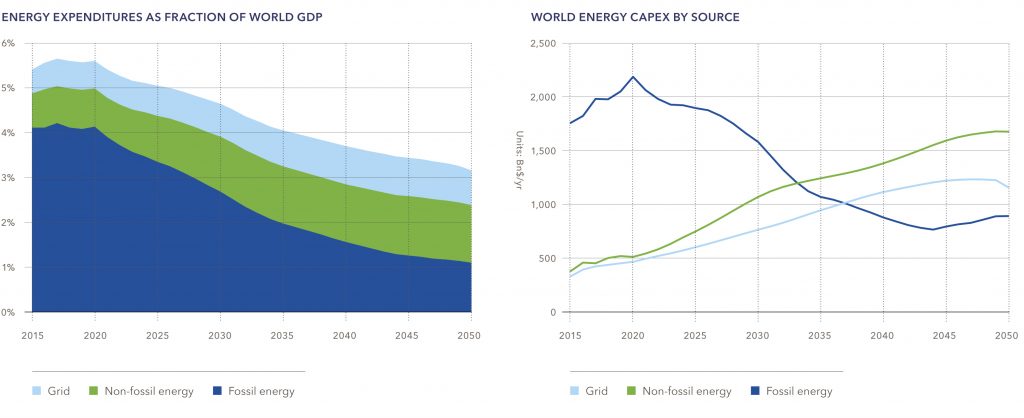
Fig. 5. Share of energy costs from world GDP,%, and capital investment in the network, fossil and renewable energy sources, $ billion / year, 2015-2050. Source: DNV GL «Energy Transition Outlook 2018, a forecast to 2050».
Annual investments in non-fossil energy, together with the related costs on the network, will increase by almost 3.5 times to $ 2.4 trillion, see. Fig. 6. Global investments in the development and maintenance of electricity grids will increase from $ 0.49 trillion. up to> $ 1.5 trillion by the middle of the century. However, by 2050, global spending on energy will fall from 5.5% to 3.1%, while the global economy will increase by 130% from its current state. The transition of the world model to the increased consumption of electricity itself is fully justified and probable.
Generation of electricity in the medium term will be mainly due to PV technology, its growth rate will exceed all other RES, taken together, see. Fig. 6. And among the PV generation itself, the most rapid development will be the one of distributed small and medium capacity.
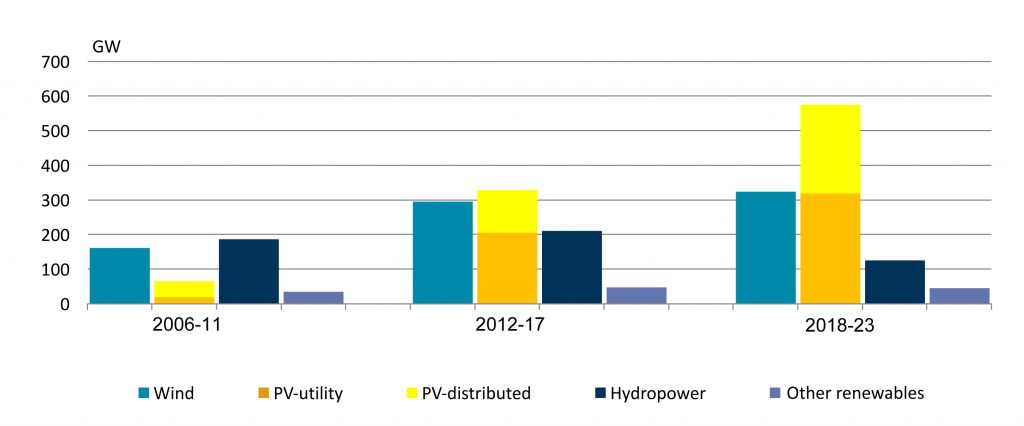
Fig. 6. Growth of the installed power generation capacity by types of RES, GW, 2006-2023. Source: IEA Renewables 2018. Market Analysis and forecast from 2018 to 2023, October 2018.
The pace of development of distributed generation is very sensitive to world prices for fossil sources, especially for fuel oil and natural gas. The IEA agency took into account this factor in its calculations and provided figures for the growth of PV capacities in the near future in a pessimistic and accelerated scenario, see. Fig. 7; The last one also takes into account the influence of the growth of prices on conventional fossil sources.
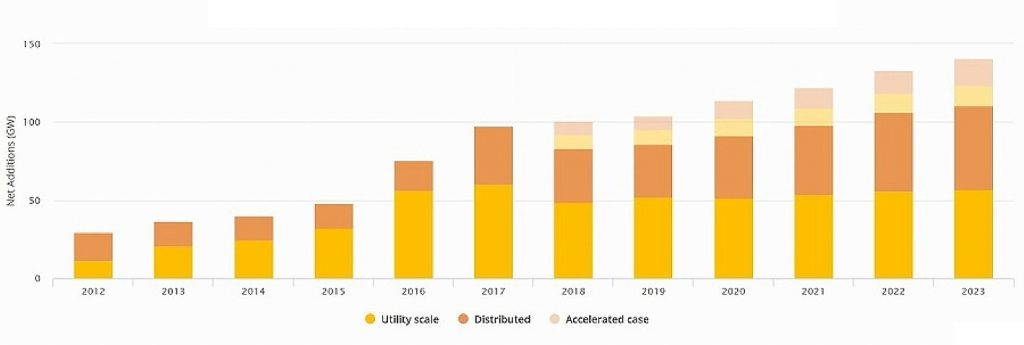
Fig. 7. Increasing of installed PV power for communal sector and small distributed generation according to different scenarios, GW, 2012-2023. Source: IEA Renewables 2018. Market Analysis and forecast from 2018 to 2023, October 2018.
The general distribution of development rate among different RESs according to the IEA’s data, see. on rice 8, the highest pace – for PV-generation.
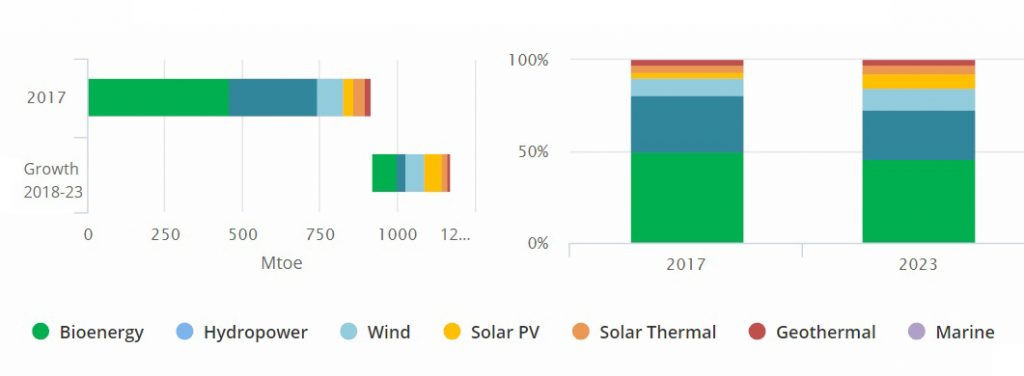
Fig. 8. Total energy consumption of different types of RES, Mt.Ne., 2017-2023. Source: IEA Renewables 2018. Market Analysis and forecast from 2018 to 2023, October 2018.
Investment Perspectives
Solar power in relation to global investment is now at the initial stage, but in the near future it will become the most attractive sector for system and private energy investors. According to an expert from GTM Research, “we are all just starting to get on the surface of the solar power industry,” estimating expectations about global investments in PV-power in 2018-2035 worth $ 2.8 trillion. Even with this huge increase in investment, solar energy will provide up to 17% of global energy consumption in 2035, compared with 2% now. Solar power can grow up to 2050 by 65 times. At present, solar power generates about 1% of the total electricity, and only 10 years ago this quantity was so small that it could be neglected. The development of “solar” companies is just beginning.
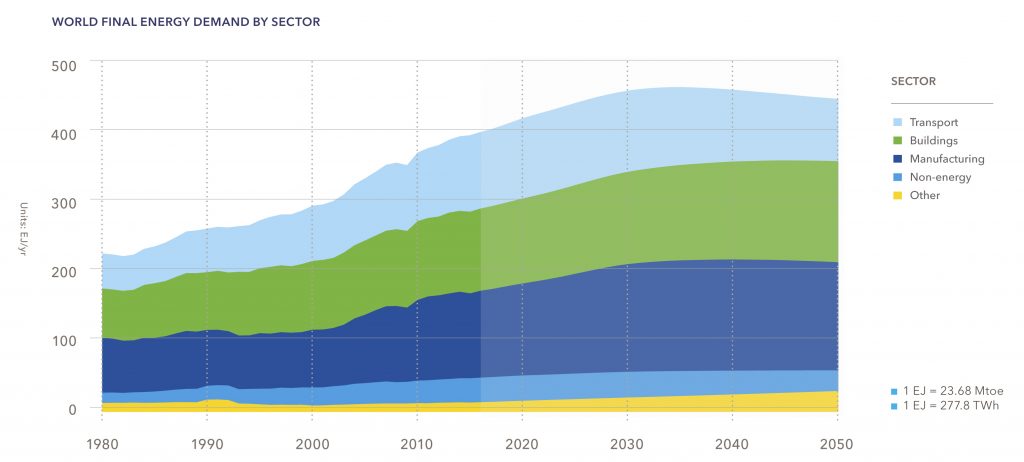
Fig. 9. World final energy consumption by sectors of economy, 1980-2050, EJ / p. Source: DNV GL «Energy Transition Outlook 2018, a forecast to 2050».
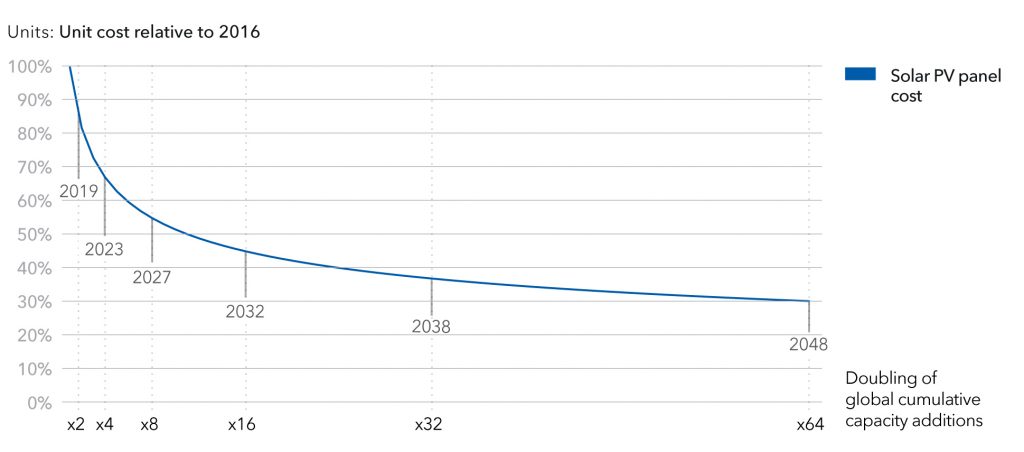
Fig. 10. Curve of expected reducing the price PV-modules from level 2016 and related consequent doubling of installed capacity of PV installations in the world, 2016-2048. Source: DNV GL «Energy Transition Outlook 2018, a forecast to 2050».
The study of prospects for energy transit by the DNV GL group provides the following to the systemic investors.
- The total world consumption of all types of energy will slow down, and from the beginning of the 2030s will slowly decline, see. small 9, due to the cumulative effect of energy saving, investments in which will continue to grow.
- The world power system is slowly “decarbonising”, that is progressing the process of a consistent refusal of all hydrocarbon energy sources. By 2050, the distribution between RES and non-RES of all types will be 50/50%.
- The demand for hydrocarbons will be the largest in 2020, and in 2026, gas will take place of the most used hydrocarbon source. Investments in the development of new deposits of fossil fuels will last until 2040. With the development of generation from alternating RES, demand for hydrocarbons will gradually decline.
- Electricity consumption will almost double by the middle of the century. Solar and wind generations will provide more than 2/3 of the world’s electricity generation. Due to the growth of total investments in energy saving in the conditions of slow growth of the population of the planet, world consumption of all types of primary energy will grow by only 45%.
- The energy transit will be relatively cheaper every year (Fig. 5). This will be facilitated by further cheaper PV-modules, see Fig. 10. Changes in the nature of global investment are expected. From 2029, the largest investment will be spent on the development of distribution networks and RES, rather than on fossil fuels in non-renewable sources, including nuclear power.
- Taking into account the facts that the current pace of decarbonization has slowed down, it is clear that the objectives of the Paris Climate Pact are currently unattainable. If global warming does not exceed 2 ° C by 2100, there is an urgent global need to increase energy savings and carbon capture and storage (CCS). The increase in the share of RES in the energy balance, apart from direct impact on the level of current carbon dioxide emissions, increases the overall level of energy savings. This effect is connected with lower energy losses from RES for the conversion of heat / electricity and transportation, especially due to the development of a small distributed generation that is as close as possible to the end users.
Read more:
How to choose the best solar modules
In the modern world, solar PV modules are one of the most efficient and sustainable energy sources. Сhoosing the right solar module manufacturer is key to maximising performance and durability.
Production Modeling for Grid-Tied PV Systems
Production modeling meets multiple needs. Integrators seek to optimize PV system designs or to provide production guarantees; investors look to verify the right return on investment; operators need performance expectations to compare to measured performance.
Some features of designing BIPV-systems
In this article we will talk about the features of designing BIPV-systems - both from an architectural point of view, and from the position of calculating an integrated solar power station, as well as the multifunctionality of BIPV-elements.
Opportunities to invest in Ukraine
Ukraine is taking important strides to increase the use of renewable-energy sources and alternative fuels as part of its broader strategy to reduce its reliance on traditional fossil fuels.