Local Expertise | Practical Experience
Production modeling of solar power plants allows for solving several problems. Engineers strive to optimize the system to get maximum power output. Investors can estimate the return on investment. Theoretical calculations will be required as a starting point when commissioning a station thereby it will help to compare the actual performance with the calculated one, and if necessary, make appropriate adjustments.
Various software environments are used for production modeling of solar power plants, but at a basic level, all calculations come down to answering two questions – how much solar radiation the station will receive and how much power it can generate.
How much sun?
The geographical location, configuration, and location of the modules, surrounding objects affect the amount of sunlight that enters the photovoltaic modules. The geographical location determines how much sunlight a power plant can access. The surrounding objects determine how much light will be blocked, and the array configuration (the location of solar panels on the ground, the method of their installation) determines how efficiently the system can receive and convert the received solar energy.
Meteorological data
Meteorological data is the first and perhaps the main factor in determining the possible amount of solar energy that will be supplied to the solar cells. This information gives a complete picture of the weather conditions in the place where a solar power station is planned to be constructed. As a rule, meteorological data include information on solar activity (global radiation, direct, diffuse), as well as on the prevailing directions of the wind and its speed, cloud cover, rainfall, etc. Data can be obtained both from long-term observations and from satellite measurements, and for some places where meteorological observations were not carried out, these data can be modeled as well.
Meteorological data is an enormous aggregation of information that needs to be analyzed, therefore there are organizations that provide data in a format that makes it easy to use them in software for calculating solar installations. This data can be distributed free of charge (National Renewable Energy Laboratory (NREL) and NASA, as well as on a paid basis (Meteonorm and 3Tier). In addition, the data provided by NREL is optimized for use in the PVWatts software environment developed by NREL itself.
For example, American engineers for the design calculations of solar power plants most often use the Typical Meteorological Year (TMY) data provided by the National Renewable Energy Laboratory based on the analysis and processing of information from the National Solar Radiation Data Base (NSRDB). Typical Meteorological Year data includes hourly solar activity data and other weather data for the year. It should be understood that the data presented are averaged values obtained over many years of observation. At the same time, the data is updated annually, which allows you to get the latest meteorological maps, which, due to long-term observations, can be used as indicators for long-term calculations. But monthly and annual calculations may have a significant inaccuracy, for example, the annual forecast may have an inaccuracy of around ± 10% and the monthly forecast of ± 30%.
Radiation models
Typical weather data include three indicators characterizing solar radiation in the form of radiation incident on a horizontal surface:
- direct solar radiation that hits the Earth in a straight line from the Sun
- diffuse radiation – part of the solar energy that falls on the Earth’s surface after reflection (scattering) from particles and molecules in the atmosphere
- total (global) horizontal radiation – under ideal conditions, this is the sum of direct and diffuse radiation, but due to measurement inaccuracy this is not always the case.
The meteorological data indicate how much solar radiation falls on a horizontal surface, but the task of the project designers is to determine how much of this sunlight will fall on the solar panels. Photovoltaic systems are installed at an angle or use single or dual-axis trackers. Various software packages allow you to calculate how much total horizontal radiation will fall on the surface of the irradiated solar panels. The accuracy of the mathematical model used depends both on the quality of the weather data and on the climate at the location of the solar installation.
In general, radiation models almost directly calculate direct solar radiation, based on data on the time of day, the position of the sun in the sky (knowing the latitude and longitude of the installation site of the solar power station), then you can use a simple geometric formula to translate direct radiation into the value actually accepted by the solar plane solar energy batteries. But the value of diffuse radiation, different mathematical models take into account differently. In the simplest, the assumption is used that diffuse radiation has the same power from all directions. More complex mathematical models take into account the factor that diffuse radiation is more intense in the horizontal plane, as well as in the near-solar region, directly near the Sun. They also take into account the change in the power of diffuse radiation depending on the angle of installation of the solar panel (the larger the angle, the less diffuse radiation the panels pick up), as well as depending on the purity of the sky, the density of the cloud cover, etc.
Another factor that must be taken into consideration when calculating the received solar energy is reflected solar radiation, which comes on the panel, reflecting from the earth, roofs, and other objects. The power of the reflected radiation depends on the reflection coefficient of the surface, as well as on the installation angle of the panels. If the angle is zero, then the array does not receive reflected solar radiation. The larger the installation angle is, the more reflected solar radiation the module will receive. In addition, the calculations should take into account the fact that the reflection coefficient of the surface varies throughout the year. For example, snow cover has better reflective indicators than just the earth one. Some calculation programs (PVsyst and PV*SOL) contain an annual change in the surface reflection coefficient.
Shading
A simple estimate of the amount of solar radiation falling on the surface of the array of photovoltaic panels is not always applicable. Depending on the location, area and configuration of the solar array, large tall objects (or even not high, but located close enough) can block the access of solar energy – in other words, obscure some area of the array. In addition, closely spaced installations can obscure each other. The difficulty in assessing the effect of shadowing on electricity generation lies in the fact that the degree of shadowing of the battery area is constantly changing due to the movement of the sun. In addition, a direct relationship cannot be used to assess the degree of power drop, for example, if 10% of the modules are shaded, then the drop in the generated power will be 10%. Such an assumption is incorrect because the shading of one cell in a module disproportionately affects the performance of the whole module, row, or even the entire array. The difficulty of accounting for shading is also in whether each case of shading is taken into account separately or are they grouped – in the latter case, the accuracy of the calculation decreases.
It is very difficult to determine exactly how shading will affect the reduction of electricity generation. Even if to conduct research directly on the ground to determine the effect of nearby objects, it will be quite problematic to determine the power drop coefficient.
Pollution
An additional factor that leads to a decrease in the efficiency of the solar power plant is the solar panels’ surface pollution. Dust, snow, bird droppings and other polluting particles reduce the ingress of sunlight, which leads to a reduction in electricity production. Power losses caused by contamination of the massif depend on the angle of inclination at which the panels are installed, the amount and seasonal variation of precipitation, the amount of snowfall, as well as the special conditions for a particular site, for example, a closely located production or a large construction site, a busy highway or other business facilities creating a lot of dust. Most software allows entering only a coefficient that estimates the annual loss caused by contamination of the array. But such an approach does not make it possible to estimate losses over a certain period of time, because losses are often seasonal in nature.
How much energy?
The second step in the industrial modeling of a solar power plant is to determine its efficiency, in other words, the amount of energy that will be obtained by converting the solar energy that gets to the installation into energy consumption.
Solar Performance Models
There are several software products that allow calculating the output power of a single solar panel or an entire array. They help to calculate the output power with different accuracy, below we will consider the most popular programs among project designers.
Sandia performance model
The software product released in 2004 by Sandia National Laboratories is one of the most accurate and reliable models for calculations. The accuracy of the calculations owing to the large number of coefficients, taking into account both features of the array (how modules are installed, tilt angle, mutual shading, etc.), indicators of solar activity and illumination (change in reflection coefficient, diffuse radiation and its variability, etc.) as well as electrical characteristics (temperature coefficient of power, voltage and current). The tests performed show that the difference between the actual values of the output power from those obtained when calculating using the Sandia performance model is about 1%.
As part of the software, the Sandia performance model is used in software packages such as the System Advisor Model (SAM) and PV-DesignPro. The main problem with using the Sandia performance model is that the database contains information about the photovoltaic modules that were tested directly in the Sandia lab. And this means that the database often does not have data on the newest, recently released modules.
Single Diode Model
This model presumes the behavior of the cell of the photovoltaic module can be represented in the form of an equivalent circuit consisting of an energy source, a diode, and two or three resistors (Fig. 1).
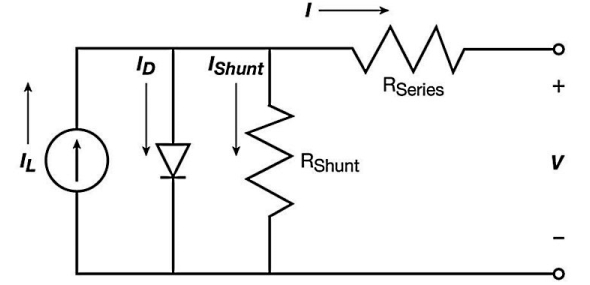
Fig. 1. Equivalent circuit of solar photovoltaic module.
The electromotive force (EMF) source and diode are an almost ideal model of a solar battery, and the use of resistors allows to simulate real losses, for example, current leakage or resistance between a semiconductor and metal contacts. Using this circuit, it is possible to compose equations that will describe the current and voltage characteristics of the equivalent circuit, while data for the equation can be obtained from the specifications specified by the manufacturer, for example, open circuit voltage or short circuit current. The single diode model is used as a mathematical model in the PVsyst and SAM software packages.
PVFORM Model
The mathematical model used by PVWatts is a simplified Sandia performance model. This model uses wind speed, ambient temperature and the calculation of solar radiation incident on the solar module surface to obtain the value of the working temperature of the solar battery, allowing you to finally get the value of the output power. The approximations and simplifications used make it possible to carry out very accurate calculations for transparent silicon modules, but are not suitable for the calculation of thin-film modules.
Direct current loss
The main parameters that determine the amount of direct current generated for a certain level of illumination are:
- the efficiency of technology that is used in solar panels;
- module temperature;
- temperature coefficient, i.e. how the temperature increase of the module affects the current generation.
In addition, when simulating production, it is important to consider the accuracy of the data indicated in the passport of the photovoltaic panel, the voltage drop across the diodes and connections in the module, the resistance of the wires that carry the direct current, and the temporary degradation of the module.
Usually, when calculating the theoretical power, several reducing coefficients are used, which make it possible to obtain a more realistic value of the power that will be supplied to the inverters. The several factors that affect the accuracy of calculations are as follows.
Passport data. The manufacturers of modules in the product passport indicate the range of accuracy with which the power was measured. For example, +/- 5%. For a 250 W module, the actual output may be less than 240 W.
As for the direct current loss, many manufacturers simply indicate in the passport a loss coefficient that can be used for calculations. However, in some software environments, such as PVsyst, PV*SOL, and PV-DesignPro, you can specify the material of the conductor, its cross-section, size and length of the wire in order to accurately calculate the losses caused by the resistance of the conductor.
Module mismatch effect.
The effect of the mismatch begins to appear due to the fact that elements having different properties are connected in one module (their current-voltage characteristics are not identical). In addition, they can work in different conditions, for example, some parts of the module may be obscured. As a result, the output parameters of the photovoltaic module are determined by the characteristics of a solar cell having the lowest parameters. And although the use of MPRT inverters allows you to automatically maintain the module at a point with maximum power, the loss due to mismatch (mismatch) of the modules is about 2%.
The efficiency of MPPT inverters.
In general, according to research data, the efficiency of MRI inverters is 98-100%
Degradation of modules.
In production modeling, it is important to consider the fact that, the power of solar modules decreases over time. This process is called degradation; under standard conditions, a photovoltaic module loses about 1% of its power per year. However, for modern models this figure is slightly lower, most manufacturers guarantee that over 25 years of operation of the module its power will decrease to 85% of the initial value. Degradation depends on the materials used in the solar panel, for crystalline modules the power drop is about 0.5% per year, but for many thin-film modules, it can even exceed 1%.
Alternating current conversion losses
Unfortunately, the process of converting direct current to alternating current in inverters is inevitably associated with power losses. In this case, several factors can be distinguished that affect the losses amount:
- losses caused by the conductor resistance, while the magnitude of the losses is directly related to the current
- losses on transformers that are not part of the inverter – in calculations, the size of losses is usually determined within 2%
In addition, as usual, the loss of electricity generation is associated with the failure of individual elements of the system, for example, a malfunction of the inverter or a short circuit in the solar cells. Such losses can be reduced due to timely and complete maintenance of the station, as well as the installation of a monitoring system that in real-time will monitor the efficiency of the station.
Read more:
How to choose a solar PV panel?
Our company, relying on the long-term experience of production and sales of equipment for solar power-stations, offers some advices, how to make correct choice of good solar panels.
What area is required to build a solar PV power plant?
One of the issues that may arise when planning a future solar power plant is the required area for the mounting of solar panels.
Work possibilities in the field of solar energy
If you are looking for a job in the field of solar energy, want to connect your career with "green" energy, dream of taking part in large projects, are not afraid of challenges and strive to achieve results, we would be glad to meet you.
Methods for determining the soiling assessment of solar PV arrays
Solar panels, especially those mounted on fixed structures, practically do not require complex maintenance. However, electricity generation can be significantly reduced due to surface contamination of solar panels. This article will be devoted to the study of this issue.