Accelerating the green energy transition
The main world markets for investment
According to REN21 estimates, 74% of global investment was received by three world leaders in electricity production with renewable energy sources – China, Europe and the United States in 2017. In particular, 45% of global investment is related to China, which is 10% more than in 2016. In second place – Europe (15%): The European Investment Bank has allocated 4.3 billion EUR in 2017 to initiatives in the energy sector. Third and fourth places were shared by the USA (14%) and Asia-Oceania, excluding China and India (11%). Smaller shares in North and South America, with the exception of Brazil and the United States (5%); India (4%), the Middle East and Africa (4%) and Brazil (2%).
In 2018, global net investment in clean energy amounted to $ 332.1 billion (Fig. 1). By the way, in 2017, the investment also exceeded $ 300 billion. But if you ignore hydropower projects with a capacity of more than 50 MW, then the total investment amounted to 279.8 billion dollars. USA (Fig. 2).
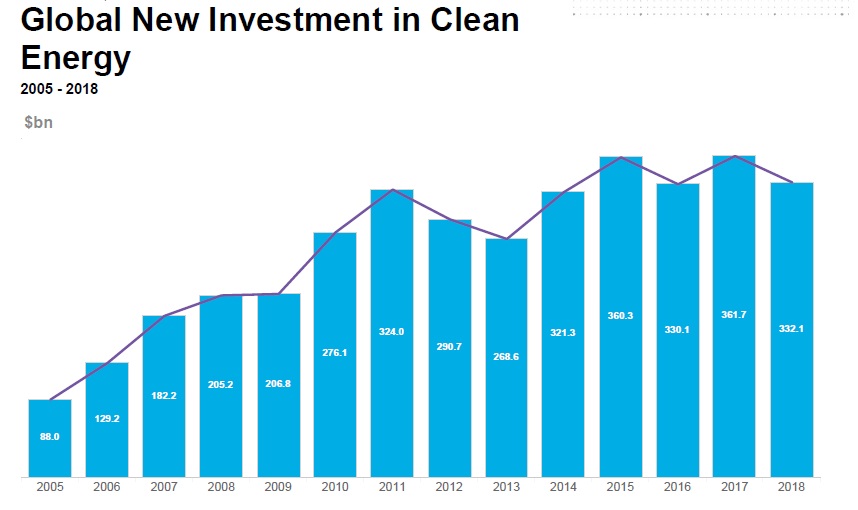
Fig. 1. Global New Investments in renewable energy sources in 2005-2018 Source: Bloomberg New Energy Finance, Clean Energy Investment Trends, 2018.
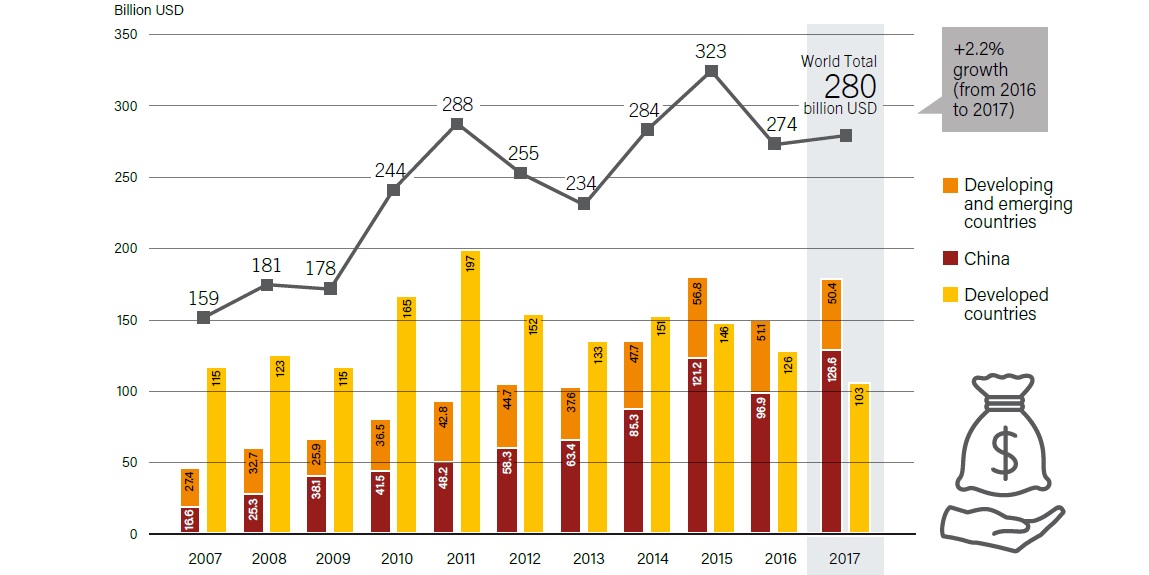
Fig. 2. Global new renewable energy and fuels investments in developed, transition economy and developing countries, 2007-2017 Source: REN21, Renewables 2018, Global Status Report, 2018. * Note. The figure does not show investment in hydropower projects with a capacity of more than 50 MW.
Investments in new renewable energy sources (taking into account the entire hydropower industry) are three times higher than the inflow of foreign investments in fossil fuel production capacity and twice in the fossil fuel and nuclear power taken together. In 2017, the leaders of investors were solar photovoltaic and wind power plants, accounting for 57% and 38%, respectively. Solar energy is the only technology, the volume of investment in which in 2017 increased by 18% compared with 2016 (Fig. 3).
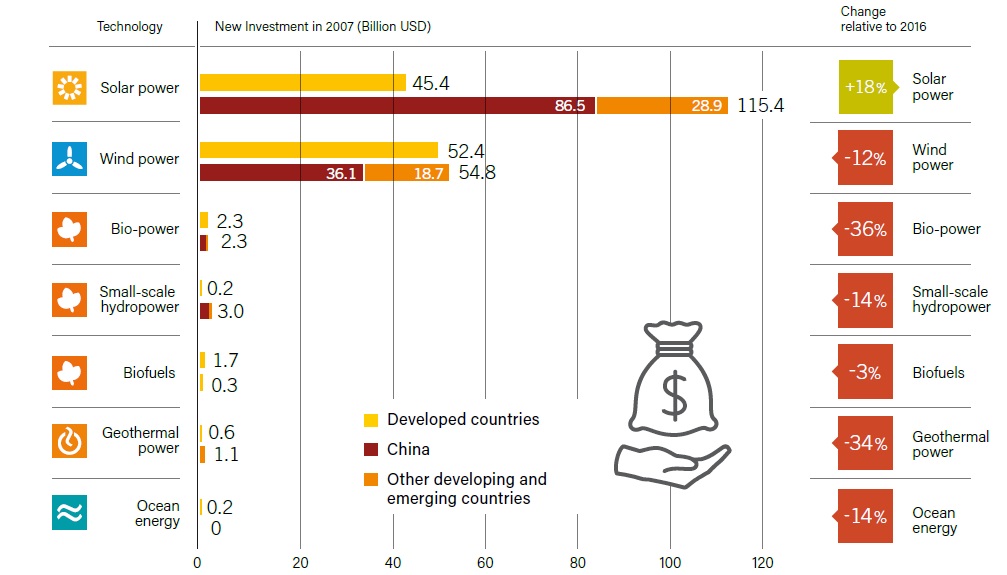
Рис. 3. Global new renewable energy and fuels investments in developed, transition economy and developing countries, 2007-2017 Source: REN21, Renewables 2018, Global Status Report, 2018.
Distribution of investments between countries and regions
In 2015, progressing and countries that are in transition economic development, first outstripped developed countries by investing in renewable energy sources, and in 2017, they expanded the leadership, accounting for a record 63%, mainly at the expense of China. Changes in the size of investment in renewable energy sources were varied according to the region, increasing in China, Latin America (including Brazil), the Middle East and Africa, but declining in Europe, the United States, Asia and Oceania (excluding China), Japan and India ( Fig. 4, 5 and 6).
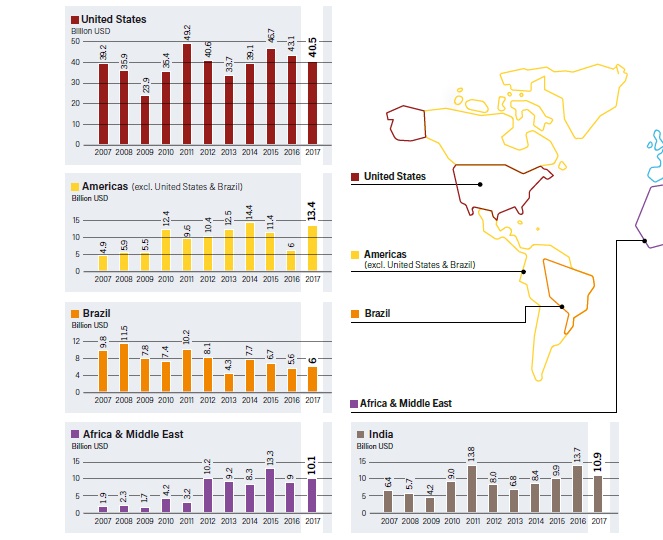
Fig. 4. New global investments in renewable energy and fuel by countries or regions, 2007-2017. Source: REN21, Renewables 2018, Global Status Report, 2018.
China’s renewable energy and fuel investments have reached a record 126.6 billion US dollars in 2017, up to 31% from 2016. A great amount of all solar energy in China accounts for more than 1 MW of solar power installations for general use, while the country’s investments in the development of small solar photovoltaic projects have increased by almost five times. For comparison, China’s total investment in wind energy amounted to 36.1 billion dollars. USA; investments in terrestrial wind power decreased by 28%, while the offshore wind power increased by 180% to $ 10.8 billion. China has also invested greatly in large hydroelectric power plants by commissioning 7.3 GW in 2017, many of which were projects with a capacity of over 50 MW.
The volume of investments into Europe amounted to 40.9 billion US dollars in 2017, which is 36% lower than in 2016 (Fig. 5). The share of assets accounts for 74% of the region’s investments, namely USD 30.4 billion, of which 26.7 billion is invested in wind energy and 2.8 billion in solar energy.
In the UK, they reduced the investment by 65%, namely to $ 7.6 billion. On the contrast, Germany has become the largest European investor with 10.4 billion US dollars, despite a 35% reduction compared to 2016. Investments have increased countries such as Sweden (an increase of 127% to $ 3.7 billion), the Netherlands (52% up to $ 1.8 billion) and Greece (an increase of 287% to $ 0.8 billion).
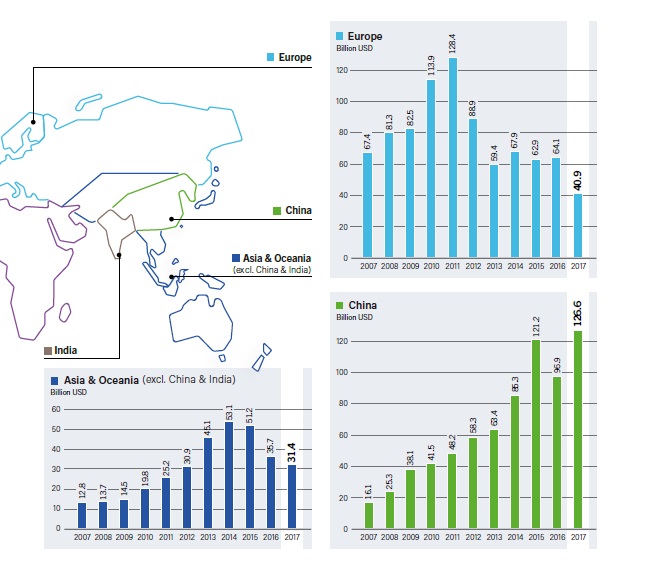
Fig. 5. New global investments in renewable energy and fuel by countries or regions, 2007-2017. Source: REN21, Renewables 2018, Global Status Report, 2018.
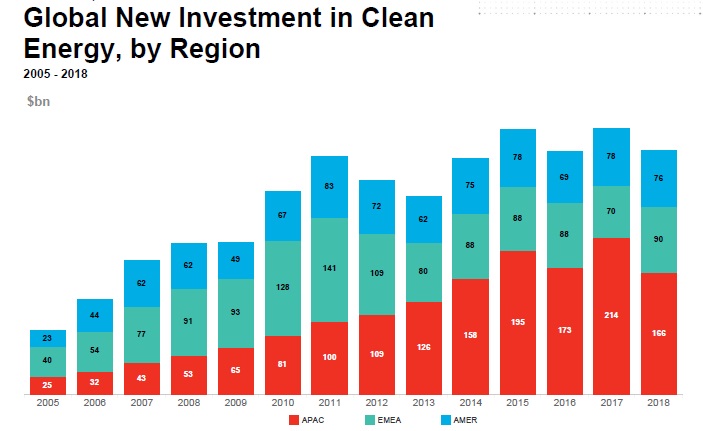
Fig. 6. New global investments in renewable energy sources by regions (Asia-Pacific / Europe, Middle East and Africa / America) in 2005-2018. Source: Bloomberg New Energy Finance, Clean Energy Investment Trends, 2018.
The United States continued to be the largest individual investor among the developed countries: in 2017, their total amount was $ 40.5 billion, in 6% less compared to 2016. Financing of communal sector assets remained stable, amounting to 29.3 billion US dollars, while the share of wind power was 67%. Although the small distributed power (on the roof and other solar energy systems up to 1 MW) also attracted considerable funds, the total amount of 8.9 billion US dollars has fallen by 12% compared with 2016.
In Asia and Oceania (excepting China and India), the inflow of foreign investment reduce by 12% to $ 31.4 billion. This is the lowest indicator since 2013, mainly due to the decline of Japan’s economy, the key net capital exporter in the world. Japan’s investments continued to decline during 2017, falling from 28% in 2016 to $ 13.4 billion. Other markets in the downturn region include Thailand (a decline of 72% to $ 700 million) and the Philippines (a decline of 77% to $ 300 million). However, some countries noted a marked increase in investment, including Indonesia (an increase of 67% to USD 1.0 billion) and Pakistan (an increase of 42% to USD 700 million).
Investments in India reduced by 20% compared to 2016 and amounted to $ 10.9 billion. The United States invested $ 6.7 billion in new solar power plants (an increase of 3%), while US $ 4 billion was invested in wind power in 2017 (a decrease of 41%).
In North and South America (outside of Brazil and the USA), investments made in total $ 13.4 billion (an increase of 124%). Investments in Mexico and Argentina jumped by about nine, to 6% and $ 1.8 billion, respectively. In other countries of the region there was a slight increase.
Total investment in Brazil was $ 6 billion. The USA, having grown by 8% compared with 2016, is much lower than the peak amount of 11.5 billion US dollars in 2008. A significant portion of Brazil’s 2017 investment was directed at wind power.
Investments in the Middle East and Africa have increased in total to 11% in 2017 to $ 10.1 billion, with a substantial increase in Egypt and the United Arab Emirates. Investments have grown six times in Egypt, to $ 2.6 billion, and 29 times in the UAE, to $ 2.2 billion. In Jordan, investments increased by 26% to a record $ 1.1 billion.
Distribution of investments by the type
- The volume of investment in global research and development (R & D) increased by 6% in 2017 to a record level of $ 9.9 billion (Fig. 7). Investments in governmental R & D remained unchanged from 2016, amounting to $ 5.1 billion, while corporate ones increased by 12% to $ 4.8 billion. Europe has become the largest regional investor in research and development again, and in 2017, investment growth was 8% (to $ 2.7 billion).
- Financing of utility projects’ assets during the year amounted to $ 216.1 billion, increasing in 0.2% compared with 2016, with solar energy projects in China on the first place, making in total $ 64.9 billion.
- Small investments in distributed power, or investments in solar PV systems up to 1 MW, increased by 15%. The small investments in China in 2017 grew five times. While investments in this category fell in the United States (-12%) and Japan (-38%).
- Investments in companies and funds of renewable energy sources in stock exchanges decreased by 6% to $ 5.7 billion. This is the minimum since 2012.
- Venture capital and private investment in renewable energy sources also declined by 33%. In 2017, to 1.8 billion dollars. USA, continuing to decline, taking into account the development of the sector, and as R & D in the field of wind and solar energy is increasingly shifting into the hands of large producers.
- Acquisition activity, which is not counted as part of a new investment of $ 332.1 billion, fell by 1% to $ 114 billion after four years of growth. Corporate mergers and acquisitions have cut down. Private share buyback has risen record five times to $ 11.2 billion. Assets acquisition and refinancing remained the largest category of acquisitions: $ 87.2 billion, an increase of 14% compared to 2016. Europe outstripped the USA and began to lead, increasing its activity by 26% to $ 37.2 billion.
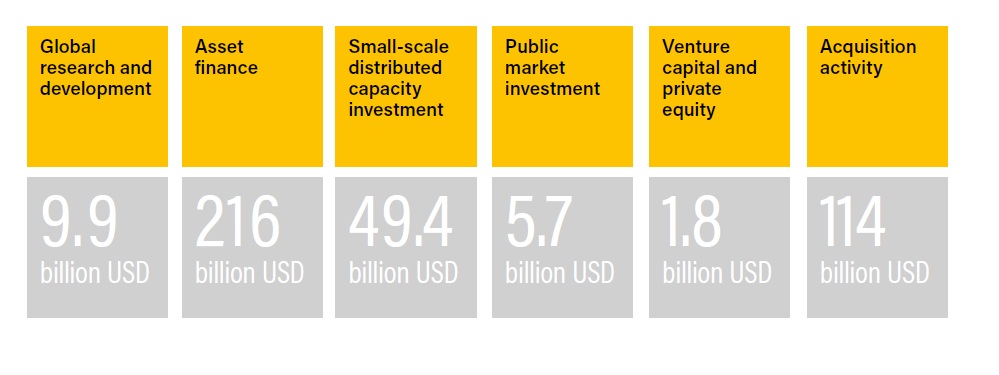
Fig. 7. Global new renewable energy investments by type in developed, transition economy, and developing countries, 2007-2017 Source: REN21, Renewables 2018, Global Status Report, 2018.
The potential for investment in renewable energy sources in Ukraine
The International Renewable Energy Agency (IRENA) introduced the REmap 2030 program in 2015. It is a series of road maps for the future of the renewable energy sources, indicating the real potential for individual countries, including Ukraine. The program contains information on how to expand the use of renewable energy sources and thereby help to double the share of these technologies in the world energy balance by 2030. IRENA specialists and experts from different countries worked together on REmap 2030.
Fig. 8 shows changes in electricity generation between 2009 and 2030. The total production will increase by 48.1% over the entire period, from 189 TWh to 284 TWh.
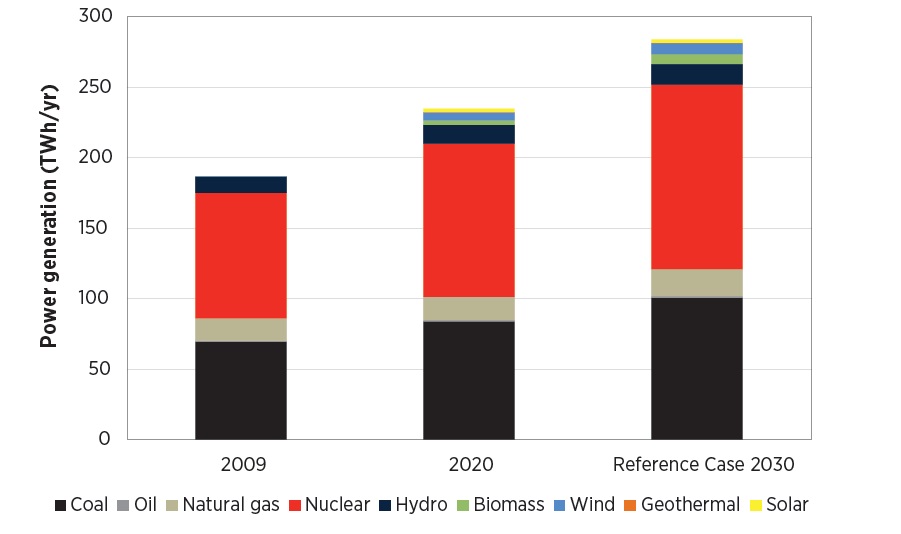
Fig. 8. Electricity production in accordance with current policy, 2009-2030. Source: IRENA together with Federal Ministry for the Environment, Nature Conservation, Building and Nuclear Safety of the Federal Republic of Germany, Remap 2030 Renewable energy prospects for Ukraine, 2015.
According to Fig. 9, the share of renewable energy in the energy sector is predicted to almost double. For industry, the share should jump from 0.2% to 13.3%, and in construction – from 6.8% to 12.3%.
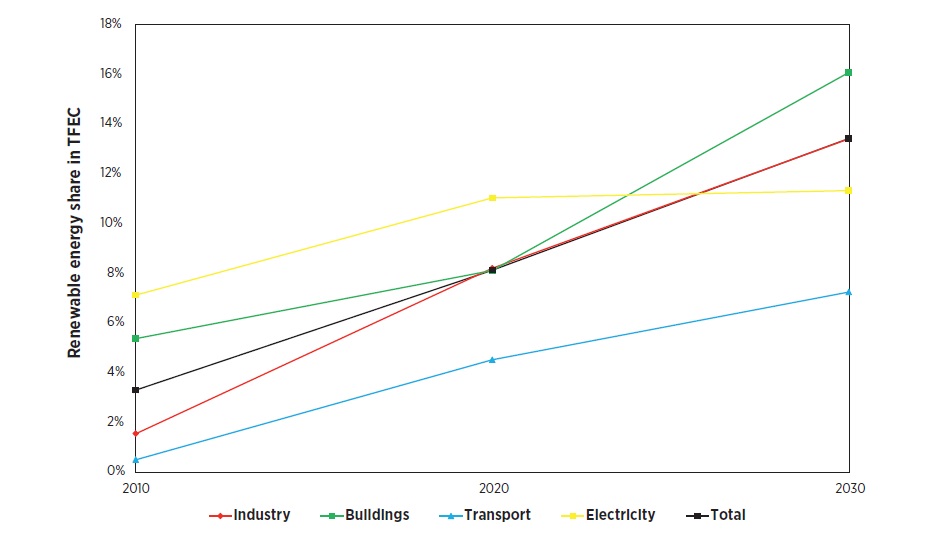
Fig. 9. Predicted development of the renewable energy share in current policy, 2010-2030. Source: IRENA together with Federal Ministry for the Environment, Nature Conservation, Building and Nuclear Safety of the Federal Republic of Germany, Remap 2030 Renewable energy prospects for Ukraine, 2015.
Figure 10 shows predictions of renewable energy sources use in total energy consumption.
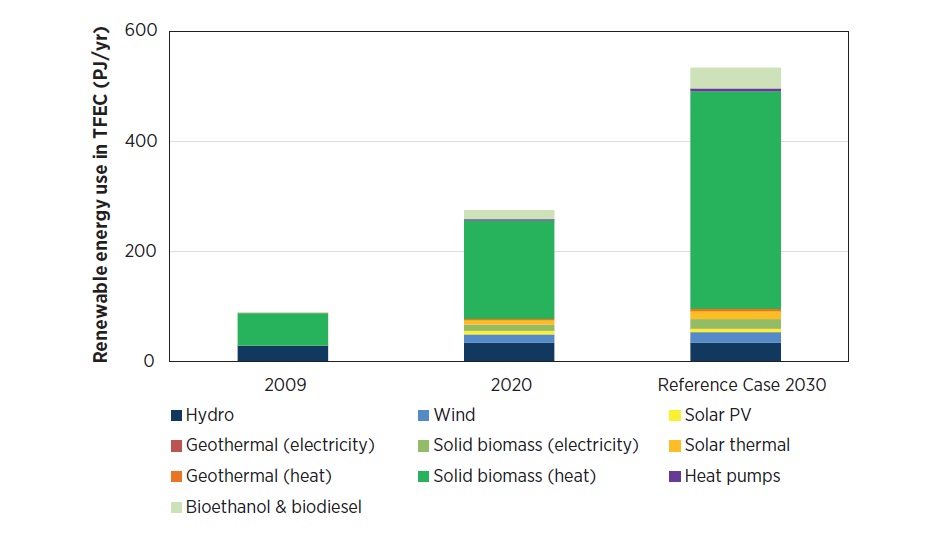
Fig. 10. Source: IRENA together with Federal Ministry for the Environment, Nature Conservation, Building and Nuclear Safety of the Federal Republic of German, Remap 2030 Renewable energy prospects for Ukraine, 2015.
In the course of the Xth International Forum and Exhibitions of Central and Eastern Europe SEF 2018 KYIV, which took place in October 2018, the prediction was mentioned that by 2030 the capacity of renewable energy sources in Ukraine will increase 9-10 times and exceed 12 GW. It should be noted that in 2018, 3 times more power generating stations from renewable energy sources were introduced into operation compared to 2017. As of October 2018, the European bank has already invested more than 123 million euros in 11 renewable energy projects in Ukraine. This year, Ukraine plans to invest EUR 4 billion in renewable energy sources. And it means that our country has a great potential for developing renewable energy sources and there is still more to invest.
Avenston’s full range of services for the construction of solar power plants covers all stages of projects, not limited to the installation of solar panels, only. By contacting Avenston, our clients can get professional expert advice on any issues in the field of solar energy and other renewable energy sources, order the calculation or design of a solar power plant, buy solar panels, inverters, metal structures or solar cables.
Key business activities of Avenston
Utility-Scale Solar Plants
We build on-grid utility-scale solar PV power plants to operate using a "green" tariff or to sell electricity through a system of "green" auctions. On-grid ground-mounted solar power plants - project, turnkey EPC-contract, connection to grid.
Commercial Solar Plants
Since 2010, we have been performing a full range of development, engineering, construction, and maintenance for all types of solar photovoltaic power systems. Huge practical experience in the construction of solar power plants for commercial use.
Floating PV Power Plants
We offer all necessary services and innovative solutions for the implementation of floating solar power plants (FPV) in Europe and the Middle East. Technical consulting, design, and turnkey EPC services.
Energy Storage Systems
A full range of services for the implementation of battery energy storage systems (BESS) for solar PV power plants and other renewable energy facilities, industry and the commercial sector. Development, design, construction and commissioning.
Equipment for Solar Power Farms
Avenston has many years of experience in planning and procurement, and supply of equipment and materials to the site. The coordination of suppliers, cost and choice of payment methods of goods delivery, and choice of optimal delivery schedule.
Backup Power Supply
We provide services for the installation of modern uninterruptible and backup power sources for commercial enterprises. Design, installation and service of low and medium power UPS. Backup power supply systems.
Operations & Maintenance
We expand the useful lifetime of facilities, maximize their profitability, streamline their performance and availability, and minimize their consumption and operating costs. Routine and non-routine maintenance, warranty, and service.
Additional Engineering Services
Avenston provides separate services related to the technical aspects of implementing projects in renewable energy: simulating, feasibility study, design, installation and electrical works.