Local Expertise | Practical Experience
Originally published in 2017, this article remains one of Avenston’s most widely read technical publications. Although renewable energy projects have become significantly more complex over the past decade, the fundamental principles of project scheduling, coordination, and risk management remain unchanged. For this reason, the recommendations presented below continue to provide practical value for developers, investors, and project managers involved in renewable energy projects today.
Gantt chart development
The most common format for a project in the construction industry is the Gantt chart, named after its developer, mechanical engineer and management consultant, Henry Gantt. This graph allows project managers and the entire team of developers, engineers, and builders to visualise schedules and the relationships between individual tasks and stages of construction. It can be created manually or with a computer program, but in any case it is based on data for a specific project.
Before creating the Gantt chart, one needs to prepare the supporting information – a hierarchical project work structure (WBS) and a network diagram.
Ultimately, the Gantt chart is well-organised information used by project managers to control the project implementation process. The hierarchical structure of the work streamlines and defines the project scale, using a hierarchical structure similar to a multi-level information tree. The network diagram defines the relationships among individual tasks and project stages.
Step one. Creating a hierarchical working structure (WBS)
The upper level of the WBS is a project that represents the total scope of the work. The project consists of smaller, differently sized and important works, which are commonly called work packages. The work coordinator often distributes work packages according to responsibility, assigning a responsible person to each package – individual, department, subcontractor. In turn, each work package is subdivided into tasks or contains its own, in volume, smaller work packages, the execution of which indicates the completion of work as a whole on the work package. The work on a work package is considered completed when people responsible for it (the team) have completed all internal work packages and all tasks (activities).
After time and cost estimates for each measure are allocated, the table becomes complex, but rather informative:
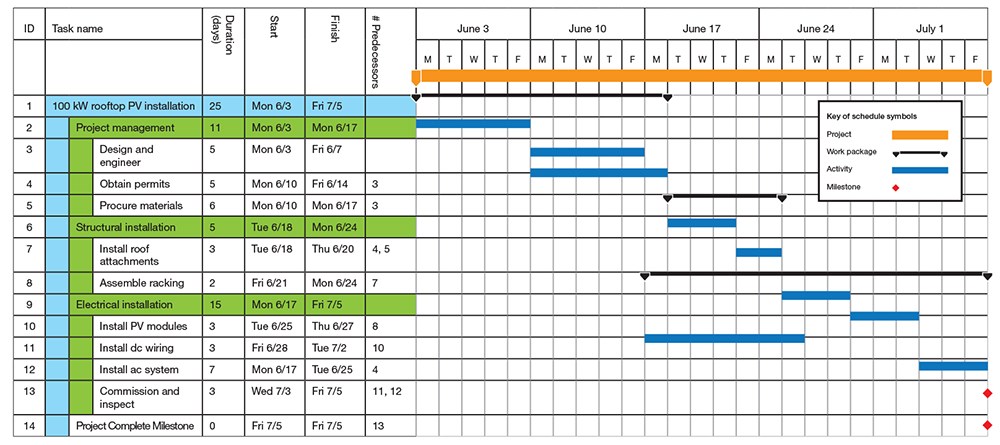
Fig. 1. Gantt chart representing the installation of a rooftop solar installation of 100 kW.
In Figure 1, the work packages are highlighted in green, and the narrow black strip with triangles at the top of the bottom is the duration of their implementation. The dark orange stripe above is the allotted time for the project. The red diamond is a milestone that marks the completion of work; it should be noted that it coincides with the completion of work in the last work package.
For convenience, the work package can be divided into smaller work packages. But this must always be 100% – all sub-items of the work package must total 100% of the whole volume of work. It is necessary to determine the list of jobs so that operations do not overlap with other work packages, and work does not move from one package to another. If an operation (individual jobs) does not fit fully into one of the work packages, then it can either be separated into a separate work package or viewed as existing ones to make sure that the operations included in the package cover 100% of all aspects of the working parts project. «The 100% rule» ensures that you do not lose any operations, which is especially important when you calculate the time and final budget for a project.
By refining work packages and individual operations, you can track and manage each level. The structure of the Gantt chart will vary depending on the features and complexity of the project. In general, each developer determines the degree of detail for themselves – theoretically, the work package can include work up to the installation of individual photovoltaic modules with detailed planning of all operations, for example, the installation of bolts and tightening nuts. On the one hand, this creates the appearance of greater control and management; on the other – it significantly complicates the chart itself, makes it cluttered, it loses clarity. In addition, creating such a detailed diagram will take a lot of extra time and increase the load on the project team. The experience shows that the implementation of circumstantial work packages creates unnecessary workload for the work brigade, and the installers will spend more time on reconciliation with the work schedule than on the job. Subsequently, with the accumulation of some experience, the developers determine for themselves some middle ground, thanks to which they plan work packages in order to ensure a sufficient level of project management.
Sometimes project managers want to abandon the development of WBS, simply by making a list. This approach greatly limits the effectiveness of the schedule and does not fully reveal its ability to plan and manage the construction of the object.
Step Two. Create a network diagram
The network diagram allows you to establish the relationship between individual operations. There is some connection/dependency between individual operations; for example, some tasks cannot be started until some previous ones are completed. Earlier actions are called “predecessors”. For example, “Starting an AC System” is a predecessor to the “Testing Commission of a Station Efficiency”.
The network diagram allows for graphically linking the individual operations/work packages throughout the project area. Relationships and sequences between operations can vary from project to project, depending on the system used in one’s work, availability of funds, employees, etc. Usually the actions are planned in sequential order. Depending on the relationship between the start/end of previous and next operations, there are four types of dependencies:
- finish-start – a new operation begins immediately after ending the previous one.
- start-start – the start of the next operation is associated with the start of the previous one, that is, actually two operations beginning at the same time.
- finish-finish – the finish of the next depends on and is connected with the end of the previous one, ie two operations are completed at the same time.
- start-finish – the beginning of the previous operation is connected with the end of the next one, ie the finish of the next one is connected with the beginning of the previous one.
An example of different types of transaction relationships is shown in Fig. 2.
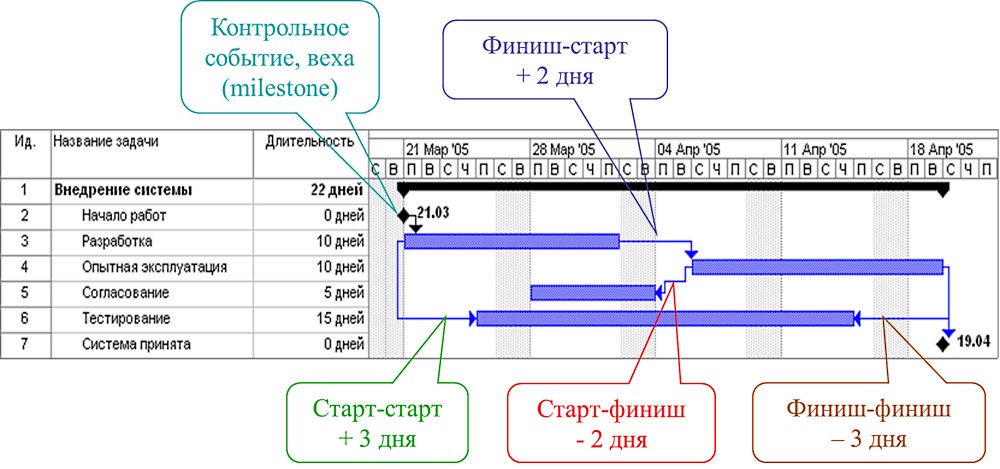
Fig. 2. Different types depending on the previous and subsequent operations.
In terms of the above relationships, you can enter a lead or a delay time. Delay time pauses between the predecessor action and the follower action. For example, if the project provides for the installation of metal structures on the concrete platform, then it will take some time from the moment of completion of concreting to the beginning of the installation on the metal platform for the concrete to harden. The leading time allows some operations, so consistently, to actually overlap in time, to follow in parallel. For example, it’s about installing a roof rack. But before starting the installation directly on the roof, it is possible to carry out preliminary work by collecting individual elements of the rack. At this point, work on the preparation of the rooftop can still continue.
The lead time and delay time – the concepts are opposite, positive time delay can be considered as a negative lead time. Many programs that automatically build Gantt charts allow you to enter only the delay time. If you need to enter the lead time, then it is entered as a negative delay time value.
Another important purpose of the timing chart is to determine the duration of each type of work or operation. The duration required to perform all the foreseen operations and operations is defined as the number of calendar days or hours, not the actual number of man-hours or man-days. Each operation has its own duration, which can be based both on the experience of the installer, based on industry standards and rules, and on the initial stage of the company’s operation – simply based on the assumptions of the design engineers. The longer the company operates, the more projects it has completed, the more experience it has gained, the more accurate the work duration estimates become.
Another important component that directly affects the duration of the work is the number of workers/brigades involved in the work, the greater the length of time it will be reduced.
Step Three. Gantt chart development
With a hierarchical structure of work and a network diagram, you can move to a summary of the available data in the form of a Gantt chart. To get the most out of the Gantt chart, it is better to use one of the software developments than to compile it yourself. It will take too much time, while the computer program will allow you to complete all the necessary work in a few minutes. Most often in the construction industry, Microsoft Project is used, but you can use other software environments, among which you can find free versions.
During the program making a Gantt chart is made, and the WBS is introduced first, while maintaining a pre-designed hierarchy of the project, work packages, and individual operations. They then enter the timing chart information, including the duration of individual operations and work packages, and reconcile relationships between individual operations/processes and work packages, coordinating their beginning and end dates.
Milestones (control events) can be added to the schedule as needed – this may be the completion of some significant, important construction steps. Usually, the milestones are contractual completion dates, such as completion of construction or complete commissioning. Control events (milestones) have zero duration and do not require any additional resources or costs. The milestone is, above all, an information tool that allows the project manager to better understand what types of work and work packages need to be completed to achieve this control event.
The Gantt chart in its final form shows the start and end dates for each type of work and work packages, as well as the start and end dates of the entire project.
Usage of the Gantt chart
Gantt Diagram – an important part of managing a project, using dates on a schedule, thanks to which id accurately possible to plan the deliveries of equipment, brigades, and subcontractors.
Updating the schedule
Since large projects never go exactly as planned, some work can be expected to be ahead of schedule, while others are lagging behind. For this reason, the schedule will have to be updated periodically to reflect the work actually completed. Here is another important advantage of diagrams made using software: when correcting only one date, changes automatically occur in all other dates. It is possible to get a complete idea of how and what`s the period of changing/delaying one date affects the execution of other operations and the whole project. This makes it possible to adjust the schedule by adjusting the individual operations for optimal results.
Critical tasks
When managing a project, a lot of attention must be paid to the critical tasks in the schedule – a series of events that have a fundamental impact on the completion date. A delay in the performance of a critical task (operation), for example, only one day, may delay the realisation of the entire project by one day. When constructing a solar power plant, the critical task is to install photovoltaic modules. If, due to unfavourable conditions, for example, due to heavy rains, the installation of photovoltaic modules is delayed by two days, then the overall term of the project will shift by two days from the expected date of the object commissioning.
Whereas critical tasks have a very large impact on the final date of construction, the project manager must determine what types of work can be classified as critical (or can be delayed). And constantly monitor that they are completed on time. As the project progresses and work is carried out, scheduled operations can change their significance and status, so correction and updating of the chart is very important.
Change chart
Just as delaying critical tasks can delay the completion of an entire project, performing ahead of mission-critical operations can lead to the delivery of an object ahead of schedule. Project managers can use this to their advantage, changing the schedule to speed up completion. You can redeploy staff/brigades and increase working hours to speed up work.
But most often a change in the primary schedule is associated with a lag in the performance of work. First of all, it is necessary to identify the range of mission-critical tasks that you need to accomplish and focus on. For example, to reduce the number of days off, it will have to pay extra for the employees, but it will allow to reduce the lag behind the schedule a little. In addition, the possibility of attracting additional workers should be considered. However, this is not always justified; for example, when it comes to working processes on the roof, increasing the number of employees will not increase the efficiency of work. Too many people will just interfere with each other. Another downside is the increased possibility of injury.
Gantt chart is the most important tool for any solar power plant installation/construction project manager. The schedule allows you to plan and coordinate the work of brigades, agree on the date of delivery of equipment and materials, track the actual execution of work with the planned, adjust the planned work if the project starts to fall behind schedule or costs exceed budgeted to focus available resources on tasks that will correct problems and eliminate delays. Upon completion of the project, designers are given the important opportunity to compare the actual schedule with the indicative (theoretical) schedule, to further use the accumulated experience and information for more accurate and balanced planning of the construction of new solar energy facilities.
Planning Renewable Energy Projects Today
Although digital project management tools continue to evolve, the principles behind effective project scheduling remain remarkably consistent. Successful renewable energy projects still rely on clearly defined work packages, realistic activity durations, transparent dependencies, continuous schedule updates, and proactive management of critical tasks.
Today’s utility-scale renewable energy projects frequently include battery energy storage systems (BESS), more sophisticated financing structures, extended permitting procedures, environmental compliance activities, and increasingly complex grid connection requirements. As a result, project schedules have become more comprehensive and involve a larger number of stakeholders throughout the project lifecycle.
Practical experience confirms that project scheduling is not simply a planning exercise performed at the beginning of a project. It is an ongoing management process that supports decision-making, improves communication between project participants, identifies emerging risks at an early stage, and helps maintain control over project implementation.
While technologies and market conditions continue to change, disciplined project management remains one of the most effective ways to improve project delivery and reduce execution risk.
Over more than fifteen years of renewable energy project development in Ukraine, Avenston has consistently applied these project management principles across projects of varying scale and complexity. The experience gained through practical implementation continues to shape the company’s approach to renewable energy development, project management, and technical advisory services for international investors and industry partners.
Read more:
Solar energy: saving money and the planet
Solar energy has rapidly become a fundamental part of the global transition to sustainable development and clean energy and is emerging as one of the most promising solutions.
Solar Power Self-consumption
Solar modules cost reduction led to solar power plant demand increase. Enterprises increase the profitability of products by installing solar power plants for self-consumption to power supply equipment, lighting fixtures, and others.
Main model contracts for project implementation
In the world practice of construction and implementation of various projects, different types of contracts are used, which regulate relations in the field of management and control of construction.
Performance Modeling Tools Overview
The calculation of the solar power plant allows you to predict accurately the amount of electricity generated by photovoltaic modules (solar panels) for specific terrain conditions, provided in case all components of the system are mounted and connected correctly.