Accelerating the green energy transition
There is the only one expert opinion at present – we are in for the global electrification of the transition to renewable energy sources and the associated transformation of infrastructure in all areas. Further development of solar power generation will be the most powerful driver of these processes. Along with the “big” changes, there will be a “small energy transition” – a total increase in electricity consumption at home and household. What are the obvious and hidden factors that will prompt to such changes?
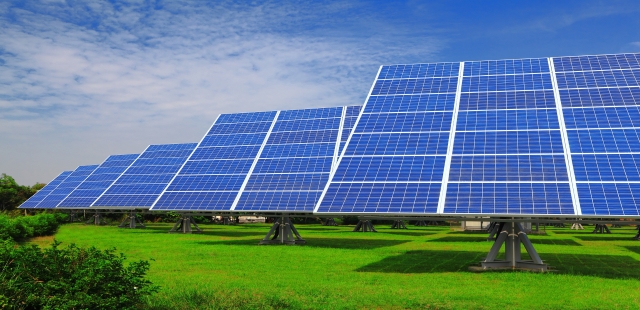
Photo: PV-farm with modules equipped with sun tracking devices.
Totally electrified future
According to the IRENA report “Renewable Power Generation Costs in 2018”, the cost of PV+CSP installations and their energy has been decreasing over the past years, while increasing the number and installed capacity (see fig. 1). It has happened globally and in all the leading countries, where solar generation has the highest share. Trends in synergies from low-cost RES and electrification will continue and make a major difference in lifestyle.
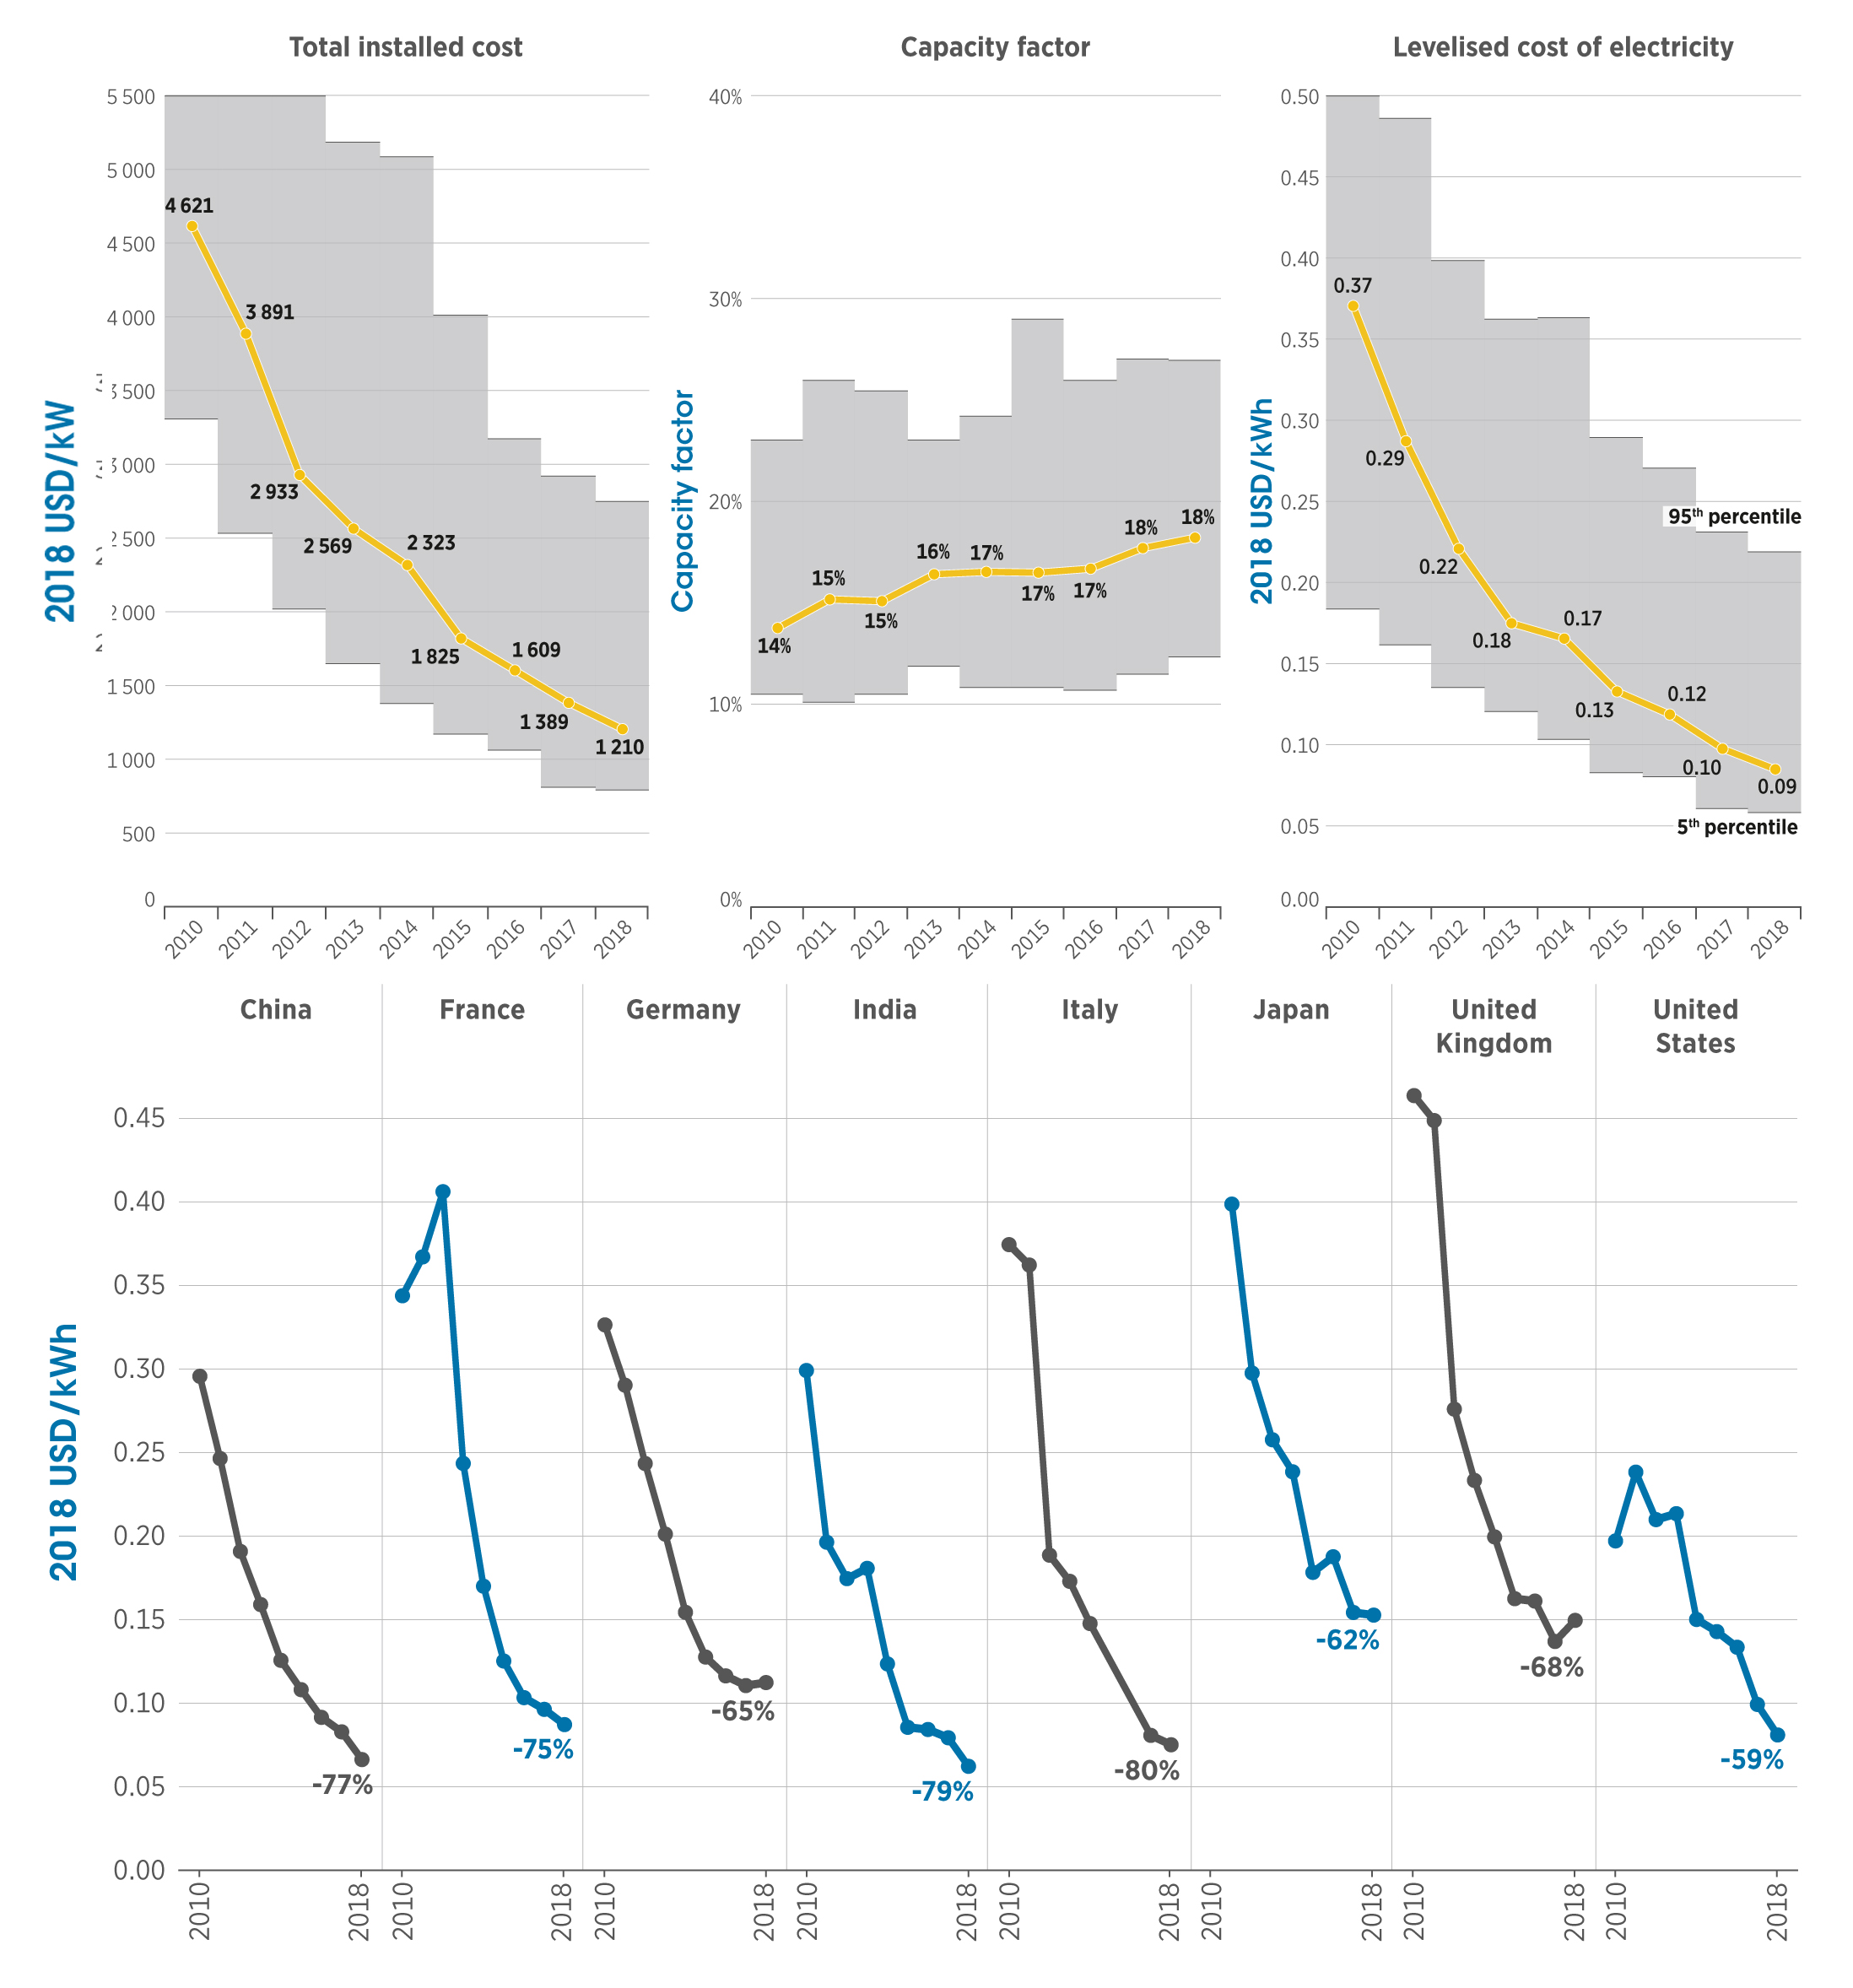
Fig. 1. Global average weighted cost per unit of installed capacity, power growth rates and weighted average cost of electricity at PV-installations and trends in utility costs for utility plants in selected countries, 2010–2018. Source: IRENA Renewable Power Generation Costs in 2018, May 2019.
The forecasts for the increase in the share of electricity in final energy consumption are shown in fig. 2. These data cover current results and expectations from the accelerated scenario of energy development by 2050. Generally, electricity consumption will increase by 2050 from the current 20% to almost 50%. This will be mainly due to the increase in the share of RES in the total electricity generation – almost 3.5 times. By 2050, 86% of electricity production will be renewable, with 60% coming from solar and wind plants – in 2050 they will install capacity of> 8500 GW and> 6000 GW respectively. The cost of renewable energy sources and the electricity generated from them will fall substantially – for PV electricity, for example, almost double.
By 2050, electricity is becoming a major energy source; see fig. 3. The share of electricity consumed in industry and construction will double. In transport, this proportion will increase from 1% today to over 40% by 2050, that is about 70% of all passenger and commercial vehicles will be powered by electricity. Overall, the number of electric vehicles in 2050 will reach> 1 billion.
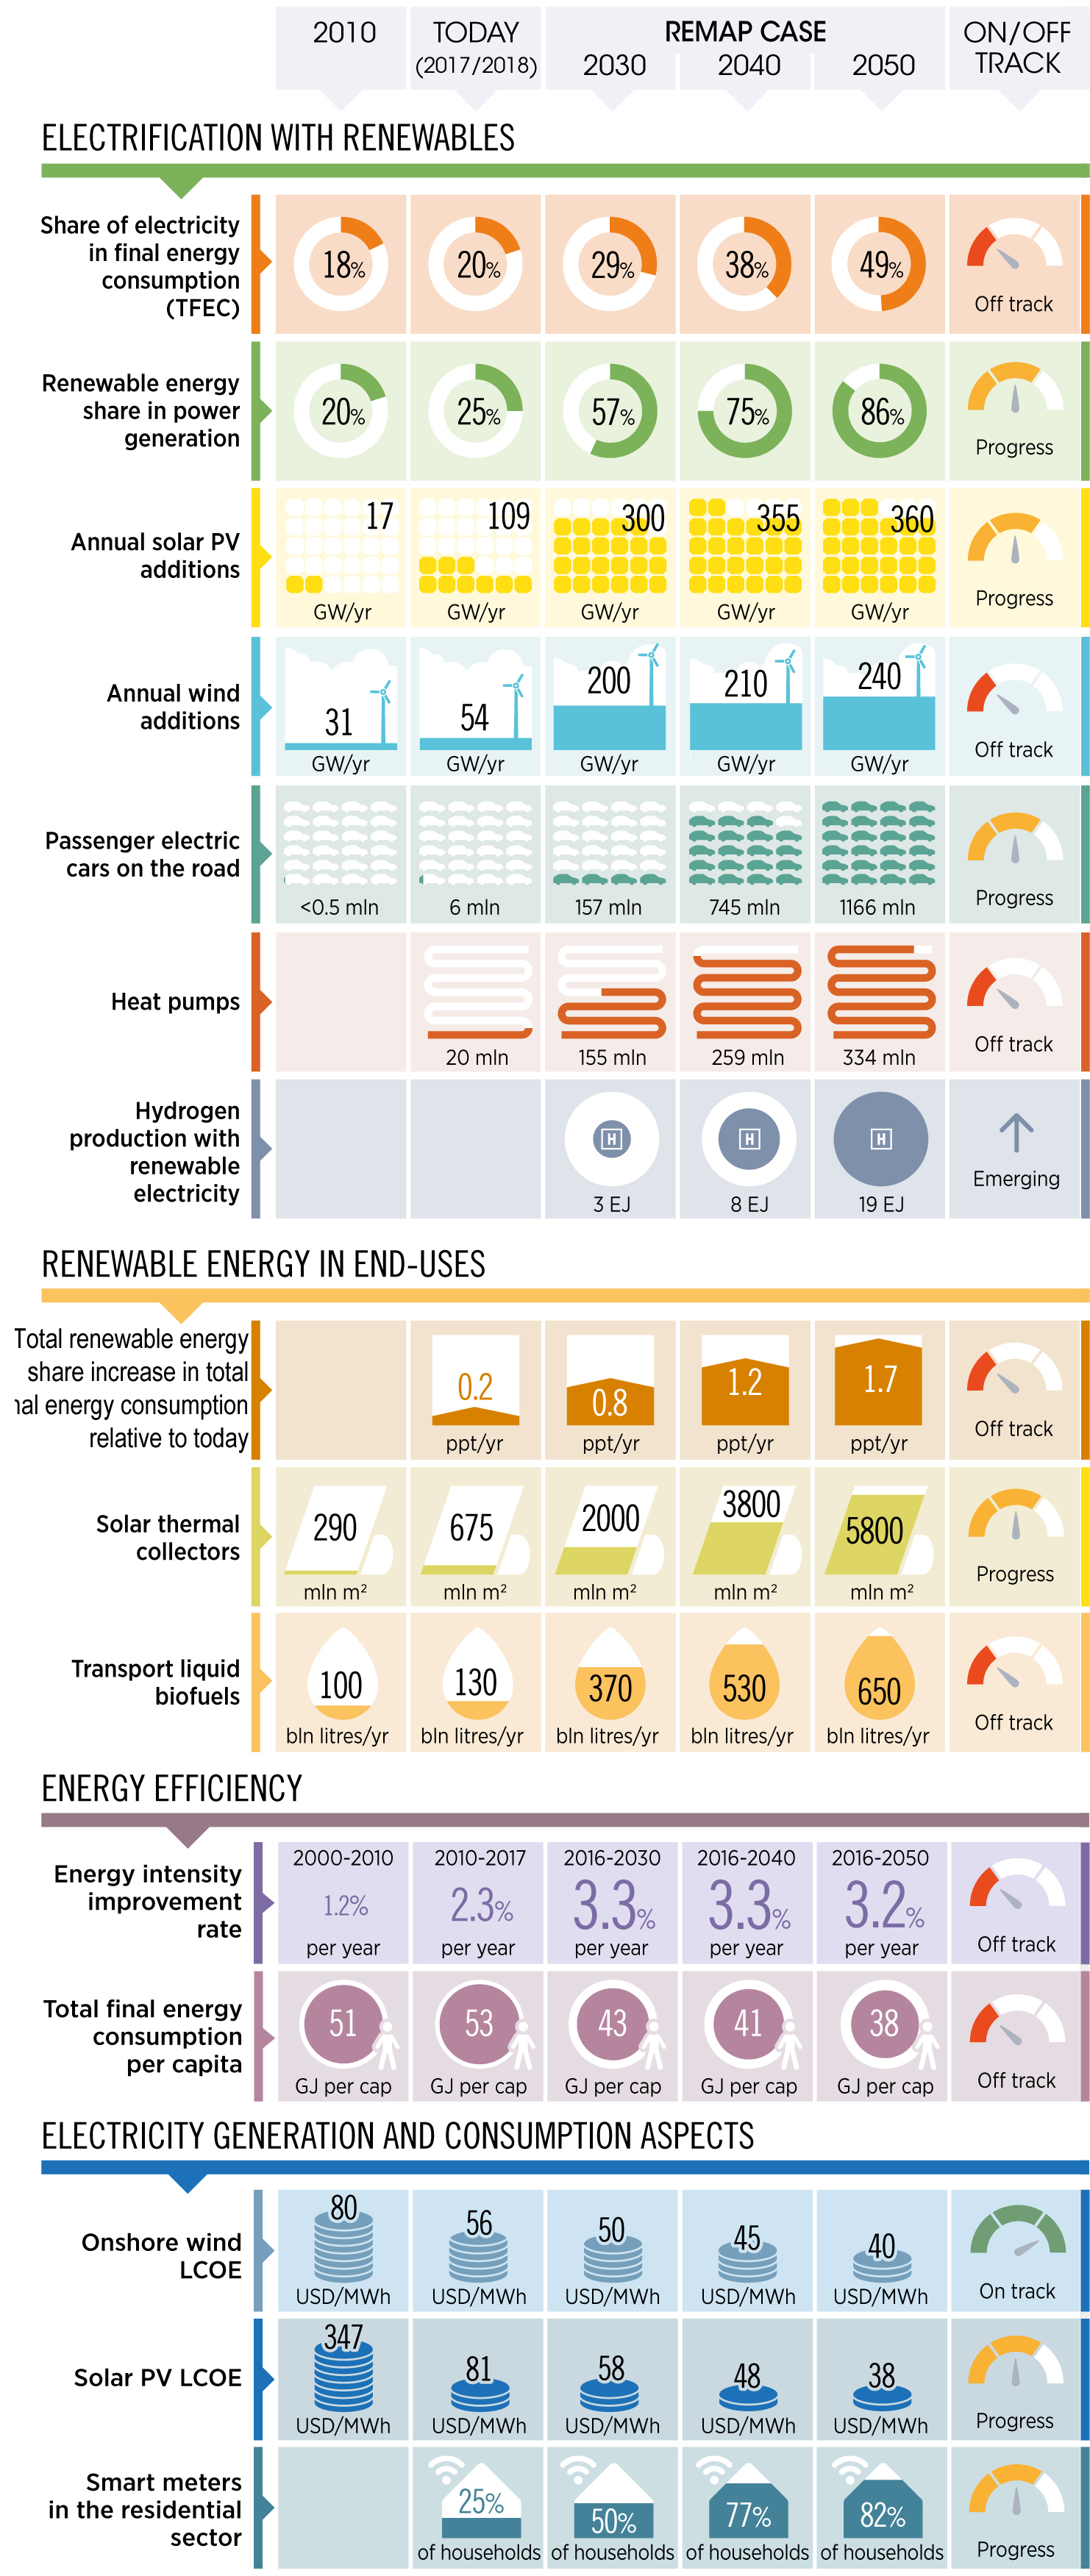
Fig. 2. Roadmap to 2050: Changes in the Key Indicators of the Global Energy System for the Transition to New Energy. Source: IRENA report Global Energy Transformation: A Roadmap to 2050, April 2019.
In addition, about 8% of the final energy consumption is accounted from renewable hydrogen (including as a raw material in industry used) and other transport fuels. As substantiated in specific studies, a total of 19 EJ of energy hydrogen will be consumed by 2050 in total.
Bioenergy development is also an important component of energy transfer. In addition to the share of liquid biofuels in transport increasing, bioenergy will play a more significant role in industries where renewable energy technologies are less suitable, for example, some high-temperature process heat in the industry. Bioproducts will become key point in the chemical and petrochemical industries, where they will be used for the production of valuable chemical compounds both as heat and as raw materials. Primary demand for bioenergy will double compared to the current level – about 125 EJ by 2050. The liquid biofuels market will increase fourfold in 2050 – from an annual consumption of 130 billion liters today to 652 billion liters in 2050.
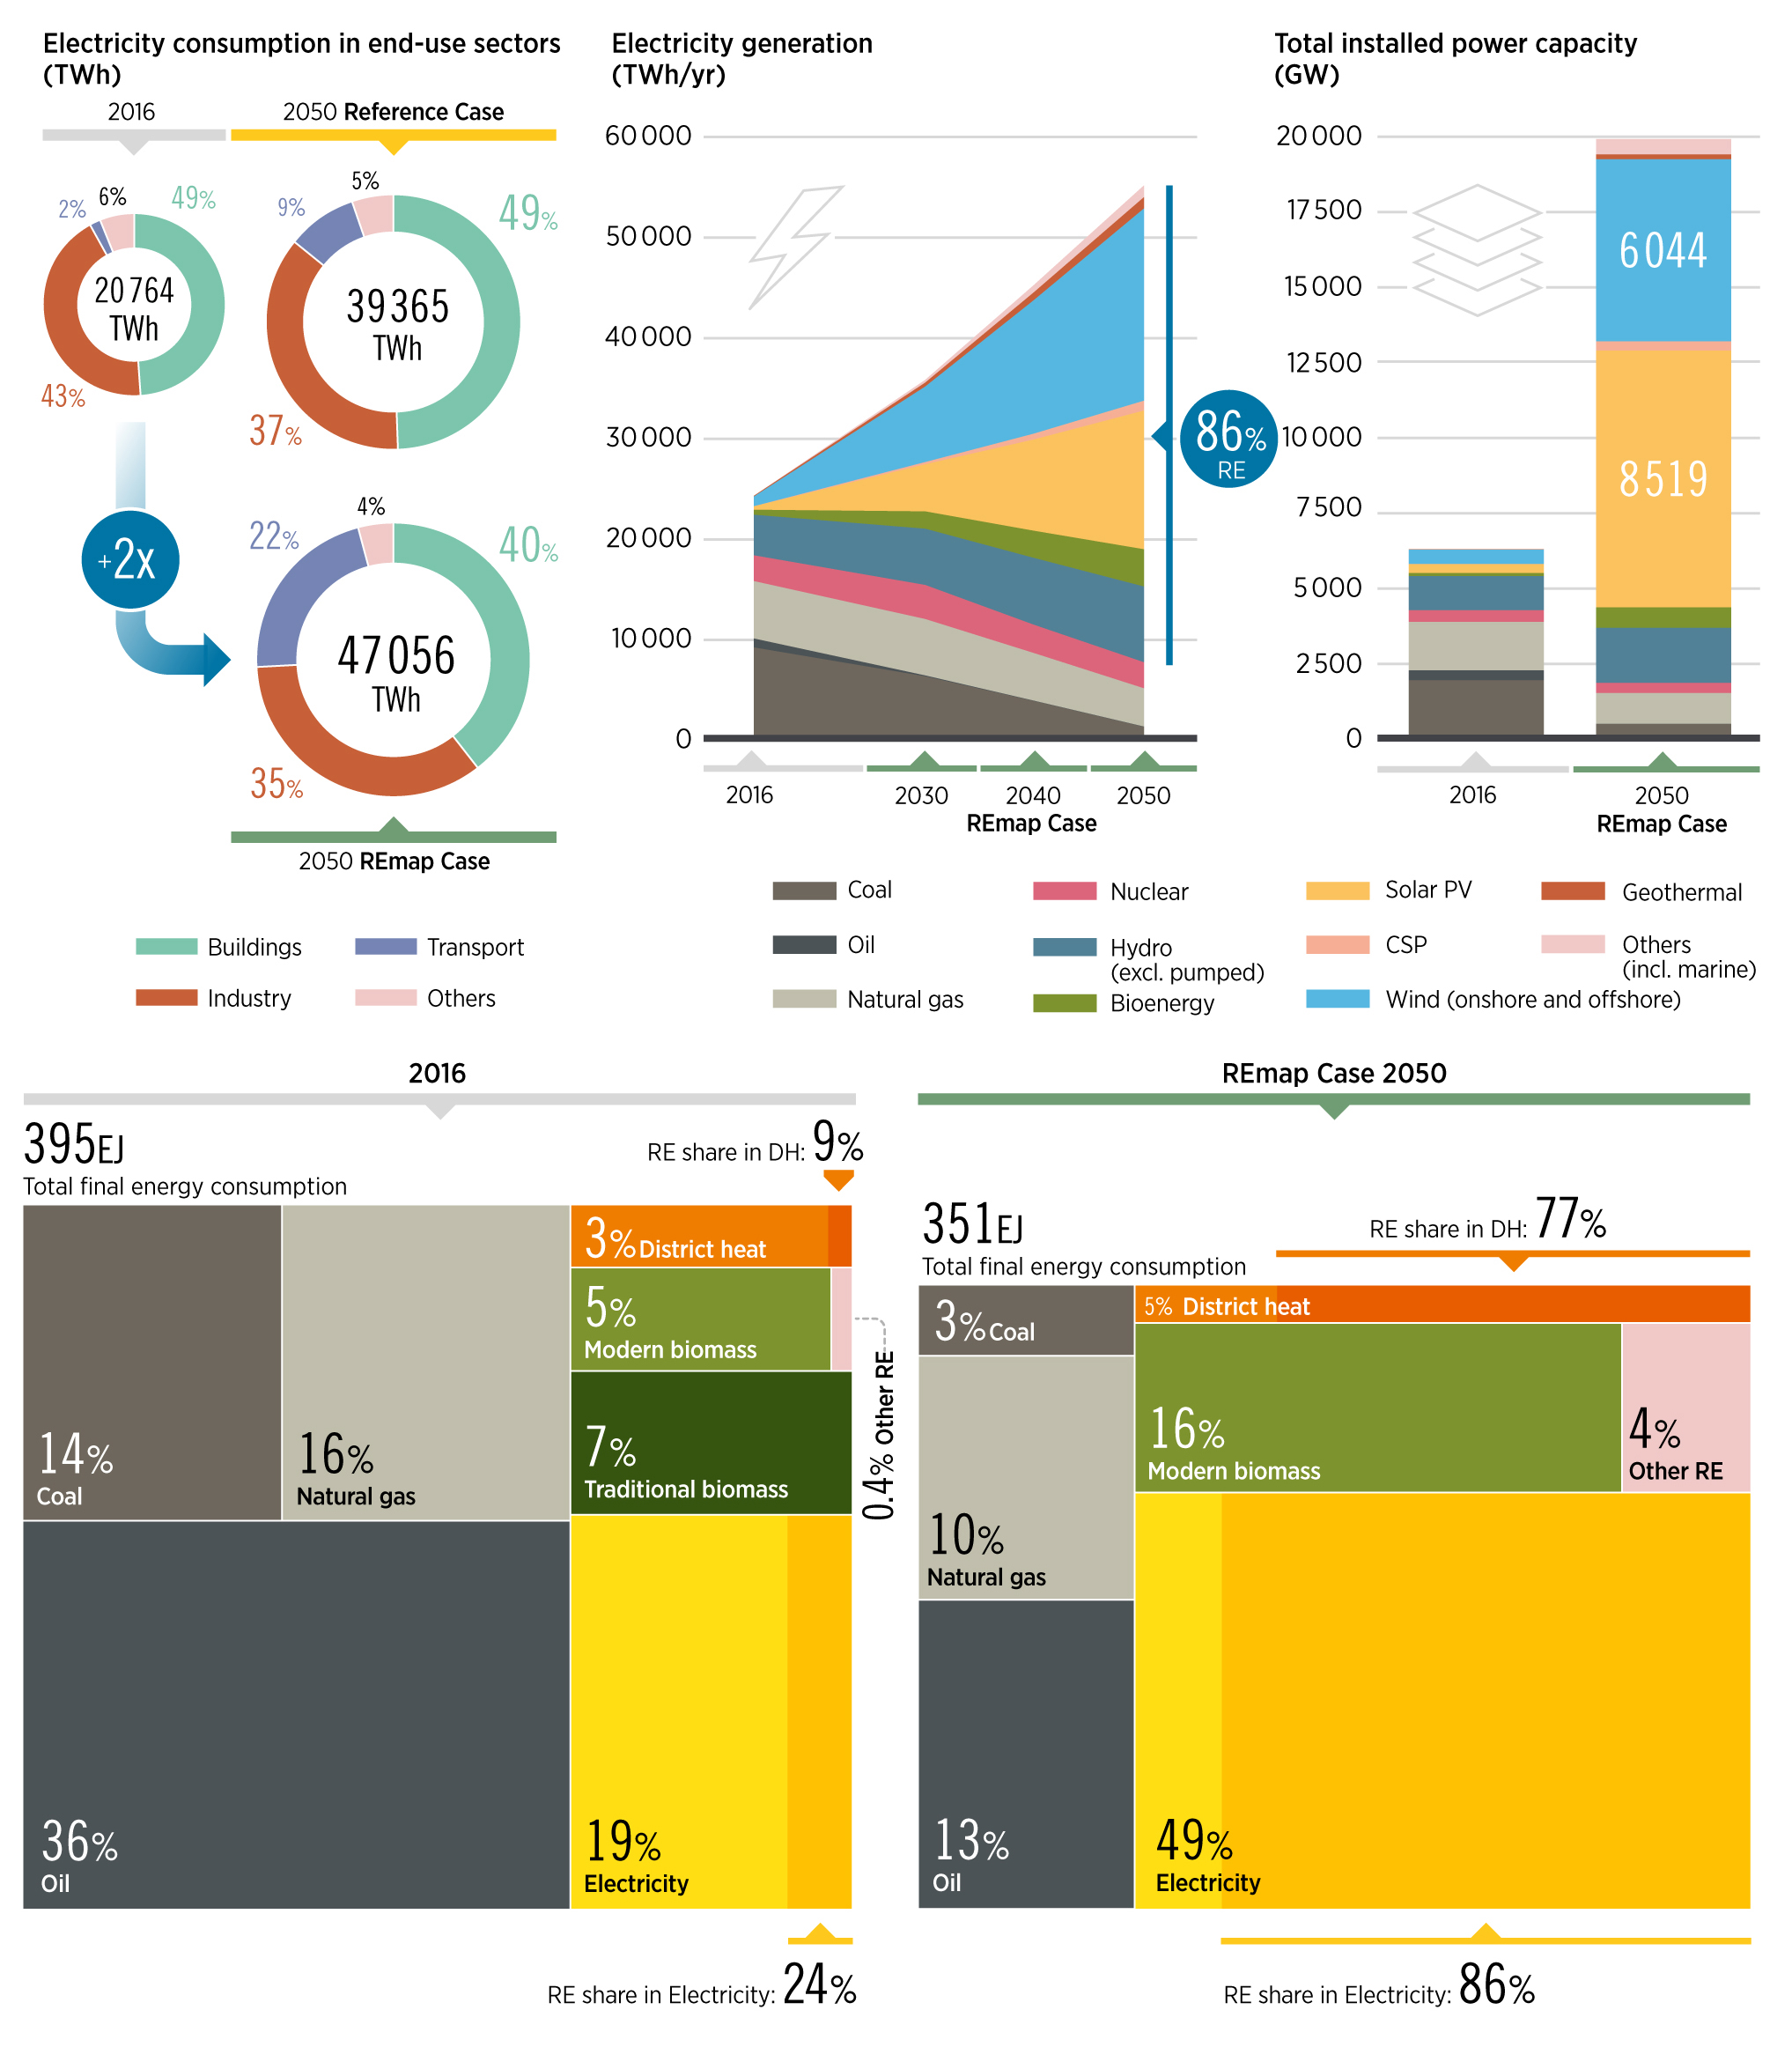
Fig. 3. Electricity consumption in different industries (TW•h,%), distribution in electricity production (TW•h / year) and the installed power generation capacity (GW) by type of energy. Distribution of total final energy consumption (TFEC) by major industries and energy sources (EJ,%). Adjusted scenario, 2016-2050 Source: IRENA Global Energy Transformation: A Roadmap to 2050 report, April 2019.
The electricity grid will increasingly change the interplay between energy production and demand. Consistency of supply/offer of large quantities energy from renewable energy sources (VREs) will require a smarter digital and flexible power system than it is today, largely due to the greater share of distributed energy sources, instantaneous electricity trading and demand response.
“Hidden” factors of “small transition”
The forecasts, based on the latest data and adjusted trends, look quite logical and consistent, confirming trends that have been identified previously. However, this does not fully explain why the rise in electricity consumption will occur virtually anywhere in the world. In end-use electricity, 86% in 2050 will come from RES (24% in 2016); including for heating/cooling this proportion will be 77% (compared to 9%), fig. 3.
The main driver of the so-called “small transition”, that is, the total increase in the share of electricity for housing and household needs, is global warming. In recent years, if not decades, there has been much criticism of this, the very presence of global warming has been under the question. However, a World Meteorological Organization publication dated August 1, 2019 puts everything in its place. The temperature level in July 2019 is the highest in meteorological observations, see. fig. 4.

Fig. 4. Earth's surface temperature map, °C, July 25, 2019 Source: World Meteorological Organization publication "July matched, and perhaps broken, the record for the hottest month since analysis began", August 1, 2019.
This year, on July 25, Belgium, northern Germany, Luxembourg, the Netherlands and the United Kingdom rewrote new national records – temperatures above 40 °C were recorded for the first time. In France, Paris, a temperature of 42.6 °C was recorded at 16:32 that day. On July 28, a new record of 33.2 °C was recorded in the Finnish capital, Helsinki, and a tropical temperature of 33.7 °C was observed in the south of the country. This hot summer 2019 data will force us to adjust the temperature map from 2016 to 2050, which was issued earlier in July 2019, see fig. 5. This map shows the CCD – the number of days when it will be necessary to additionally air-condition the air in residential and commercial premises compared to the level of 2016. For our country, for example, it will add 100-150 conditional days of air conditioning application.
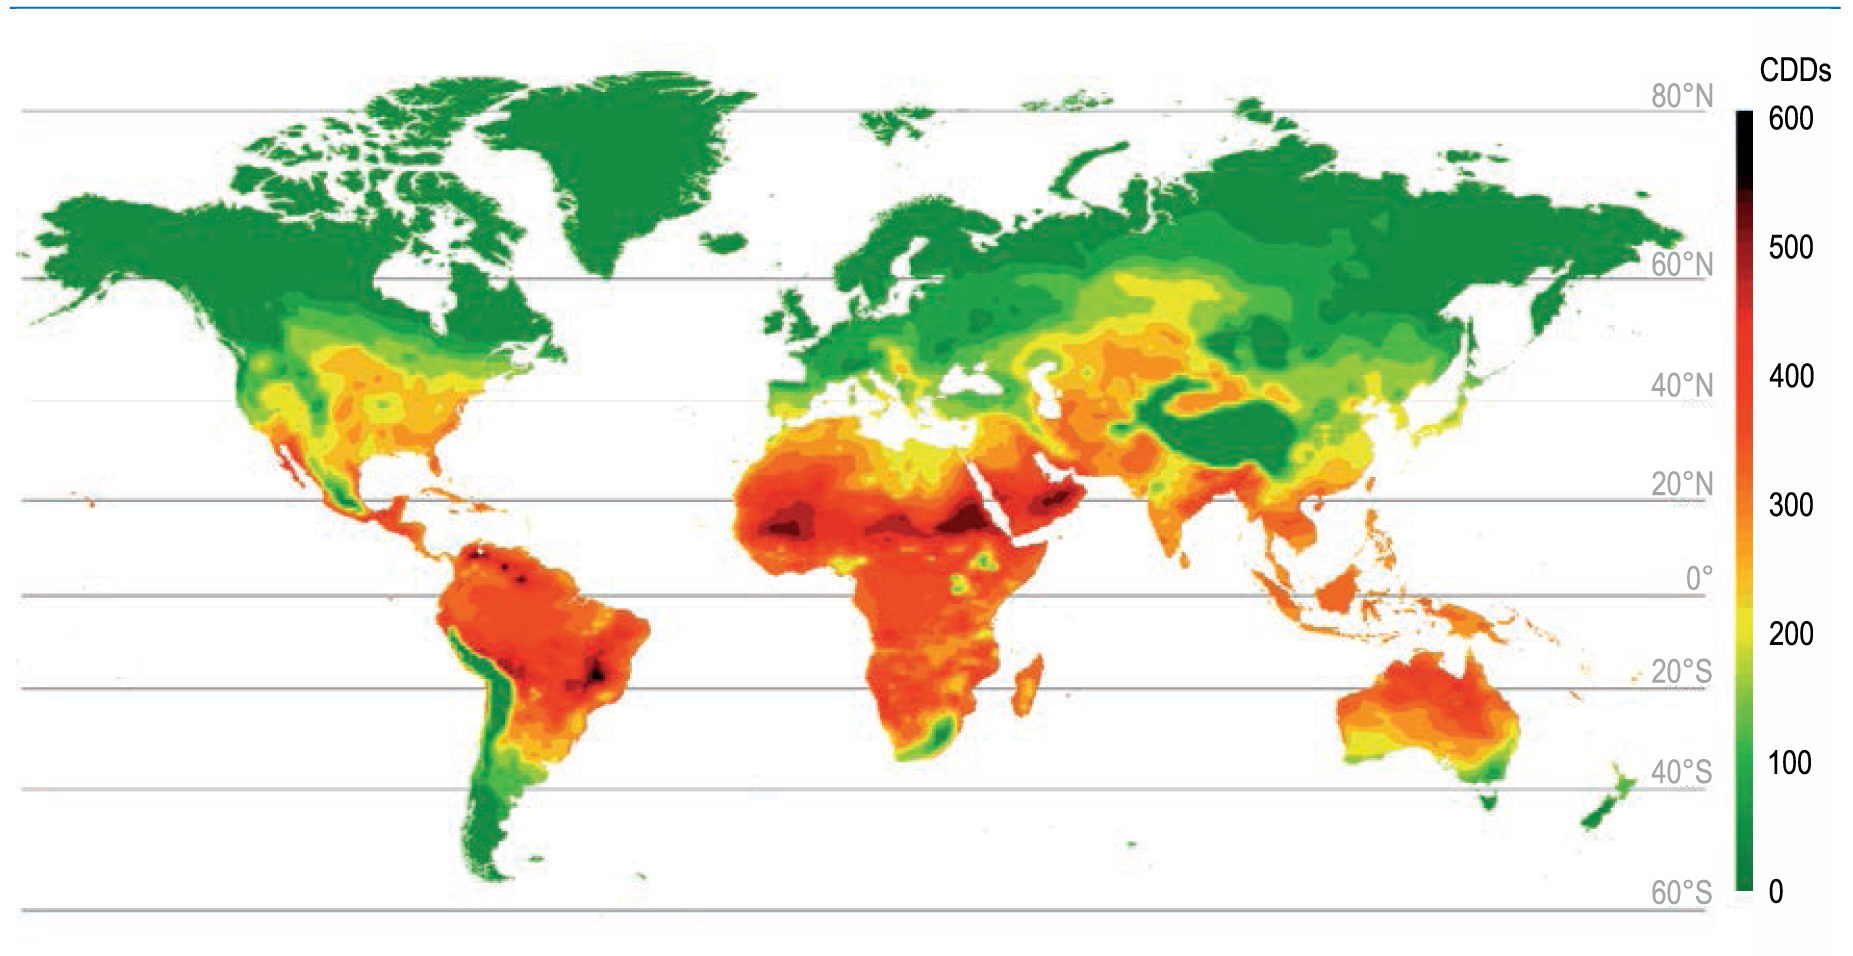
Fig. 5. Increase in the number of CDD relative to historical CDDs by latitudes, 2050 relative to 2016, baseline. Source: 2018 IEA/OECD report «The Future of Cooling» (as revised in 2019).
Temperature changes on the planet, even under the most optimistic scenarios, will significantly increase the number of air conditioners by 2050 and affect the distribution of energy for housing and living, see fig. 6. By 2050, about 2/3 of households in the world will have at least one air conditioner. Without actions to improve energy efficiency, the demand for indoor cooling will account for almost 40% of the electricity increase in homes (more than 20% of the global increase in electricity consumption).
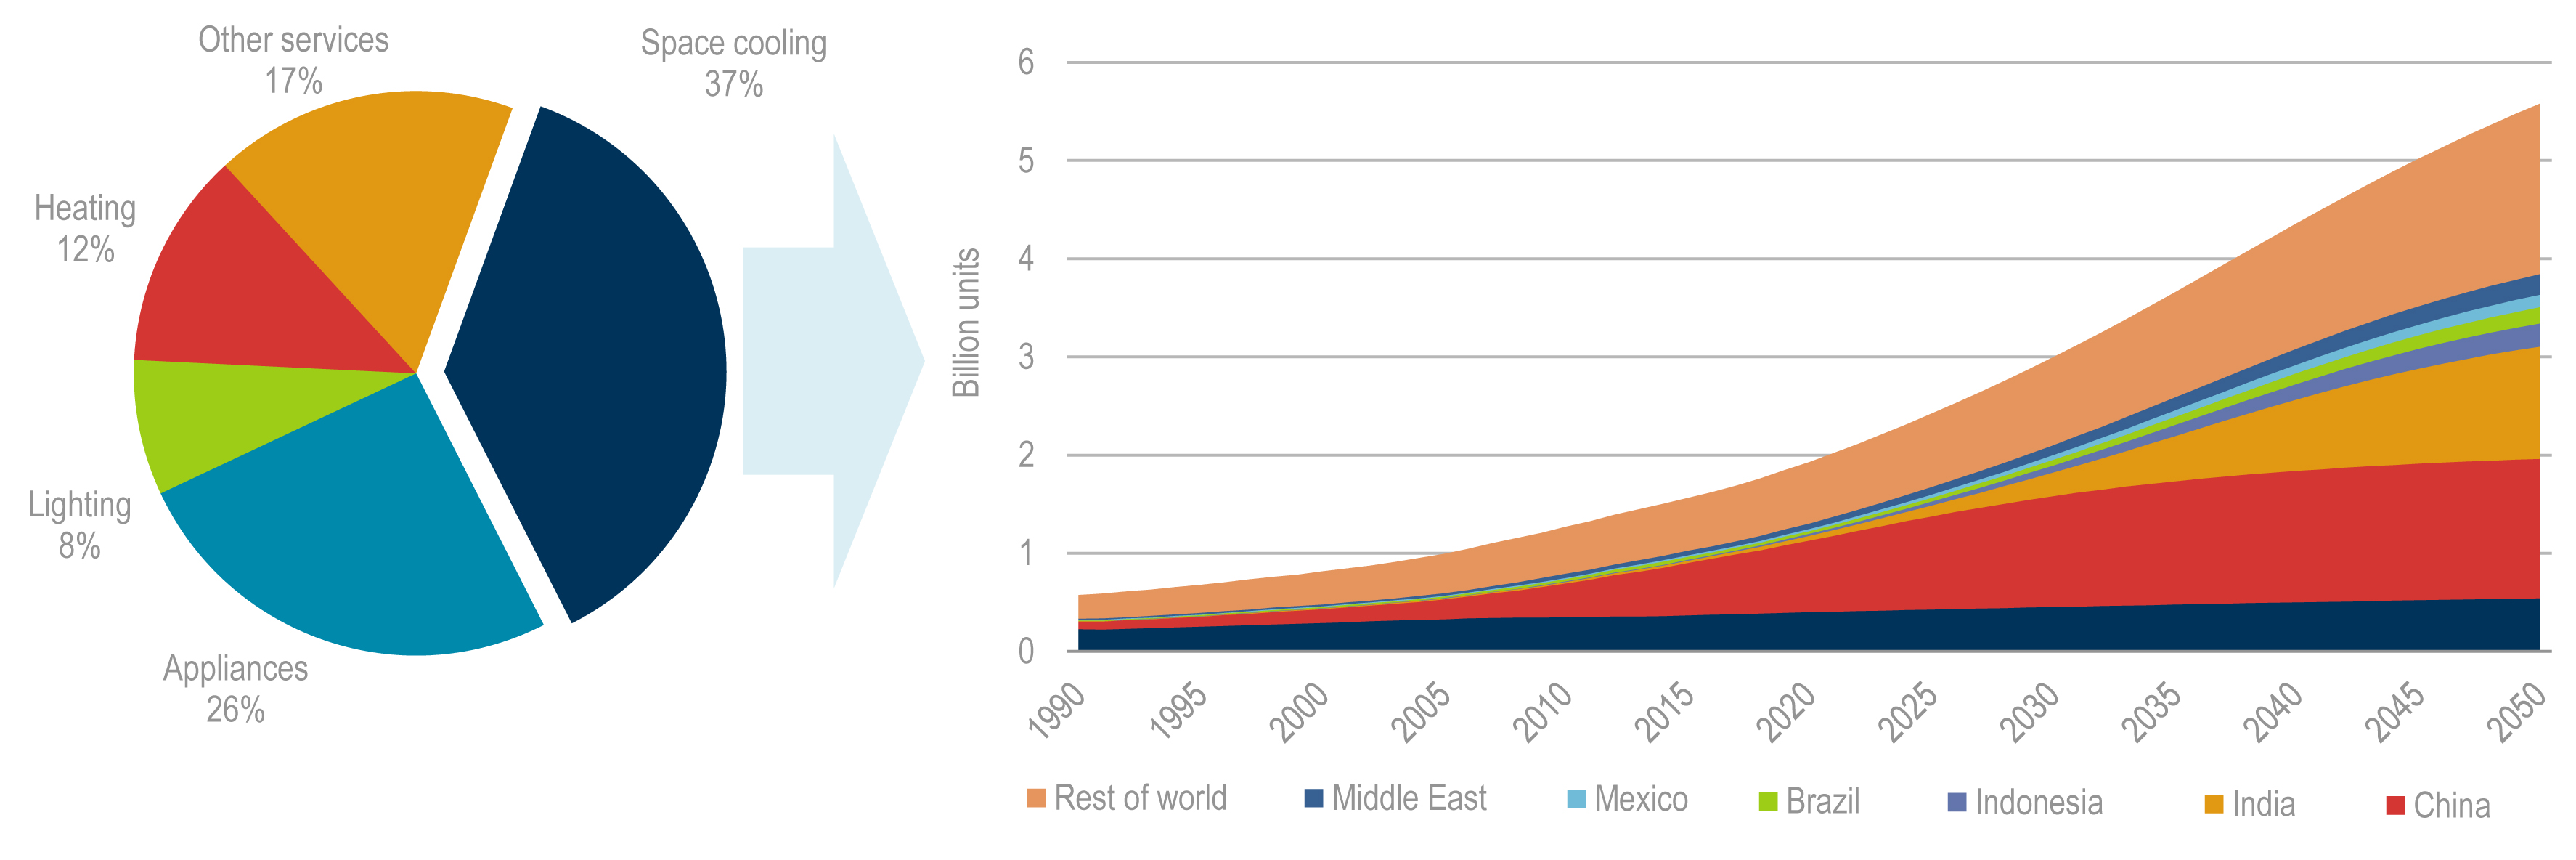
Fig. 6. Distribution of increase in final demand for electricity in homes by 2050 (%) and increase in the number of air conditioners by country (billion units). Source: Opportunities for energy-efficient air conditioning, November 2018, «IEA Energy Efficiency Division».
But there are also factors that significantly deform the “average picture” of generalized maps. They do not take into account the so-called “heat island effect”, see. fig. 7, at which the temperature in urban building is approximately 3-3.5 °C higher than in the suburbs.
Global urbanization has been around for a long time and is expected to continue over the coming decades. The share of the world’s urban population has increased from 43% in 1990 to 54% in 2016. However, according to the UN forecasts, the urban population in the world will reach 66% in 2050. This corresponds to an increase of the current urban population of 2.4 billion people, or 60%. How these people will be distributed across cities and how they will cool their homes is under the question at this time, but the building up cities will certainly enhance the effect of the heat island and increase overall cooling needs. Thus, more energy is needed to support the climate.
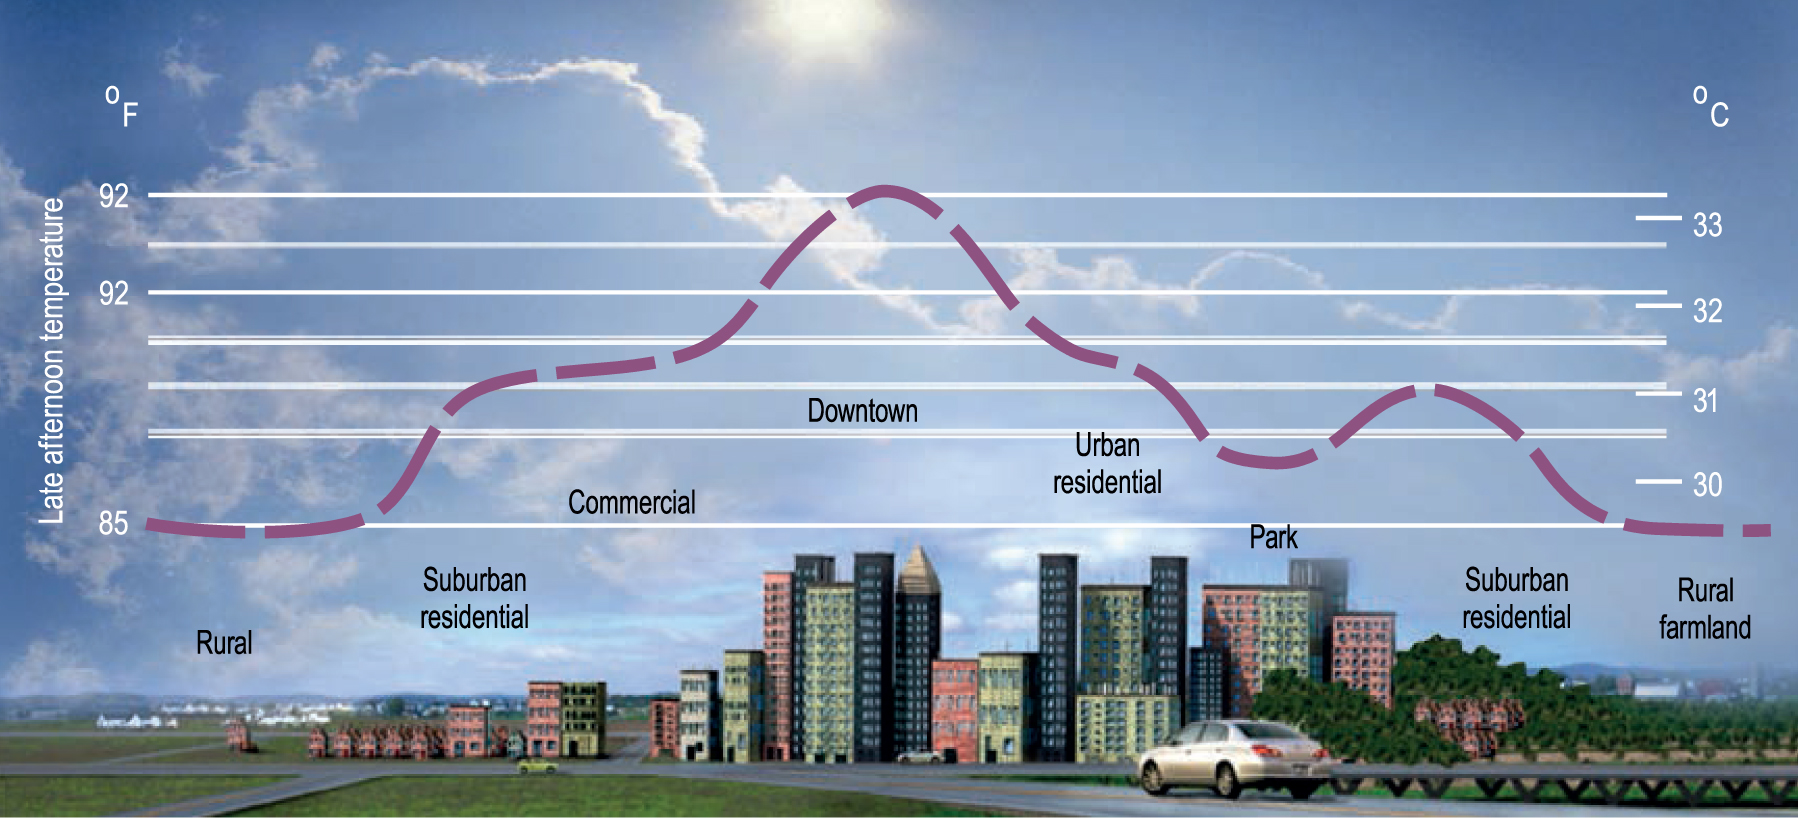
Fig. 7. Illustration of the "heat island" effects in the city center and in the suburbs. Source: 2018 IEA / OECD report The Future of Cooling (as revised in 2019).
Climate factors will accelerate the pace of “small transition”, which primarily focus on increasing electricity consumption due to air conditioning, but the need for it will create conditions for increasing electrification in all “related” household and utilities – for heating, water supply and DHW, catering etc., see. fig. 8, including the ability to connect additional power (for example, for charging electric trucks)
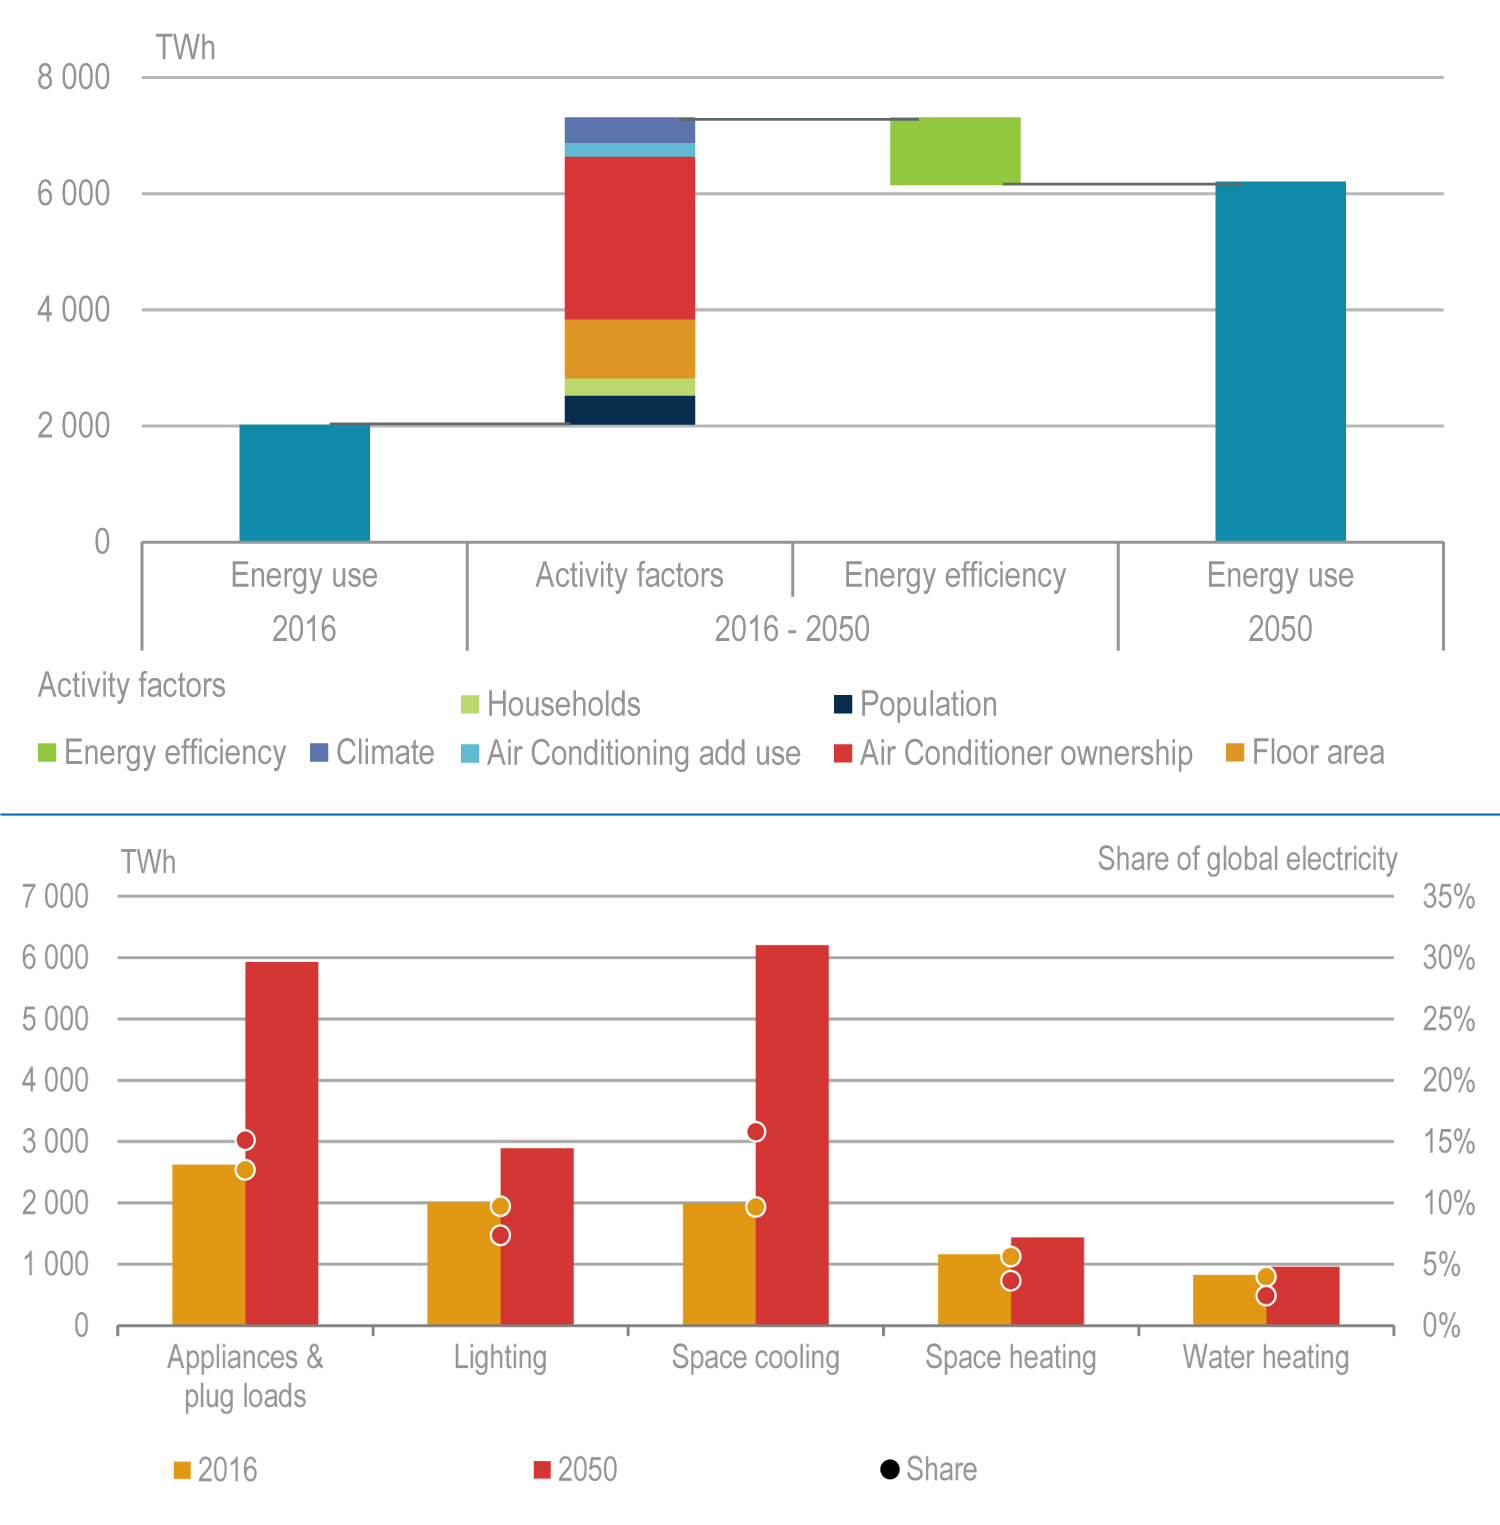
Fig. 8. Impact factors and structure of final demand for electricity of residential and domestic use, TW • h, 2016-2050. The baseline scenario. Source: 2018 IEA / OECD report «The Future of Cooling» (as revised in 2019).
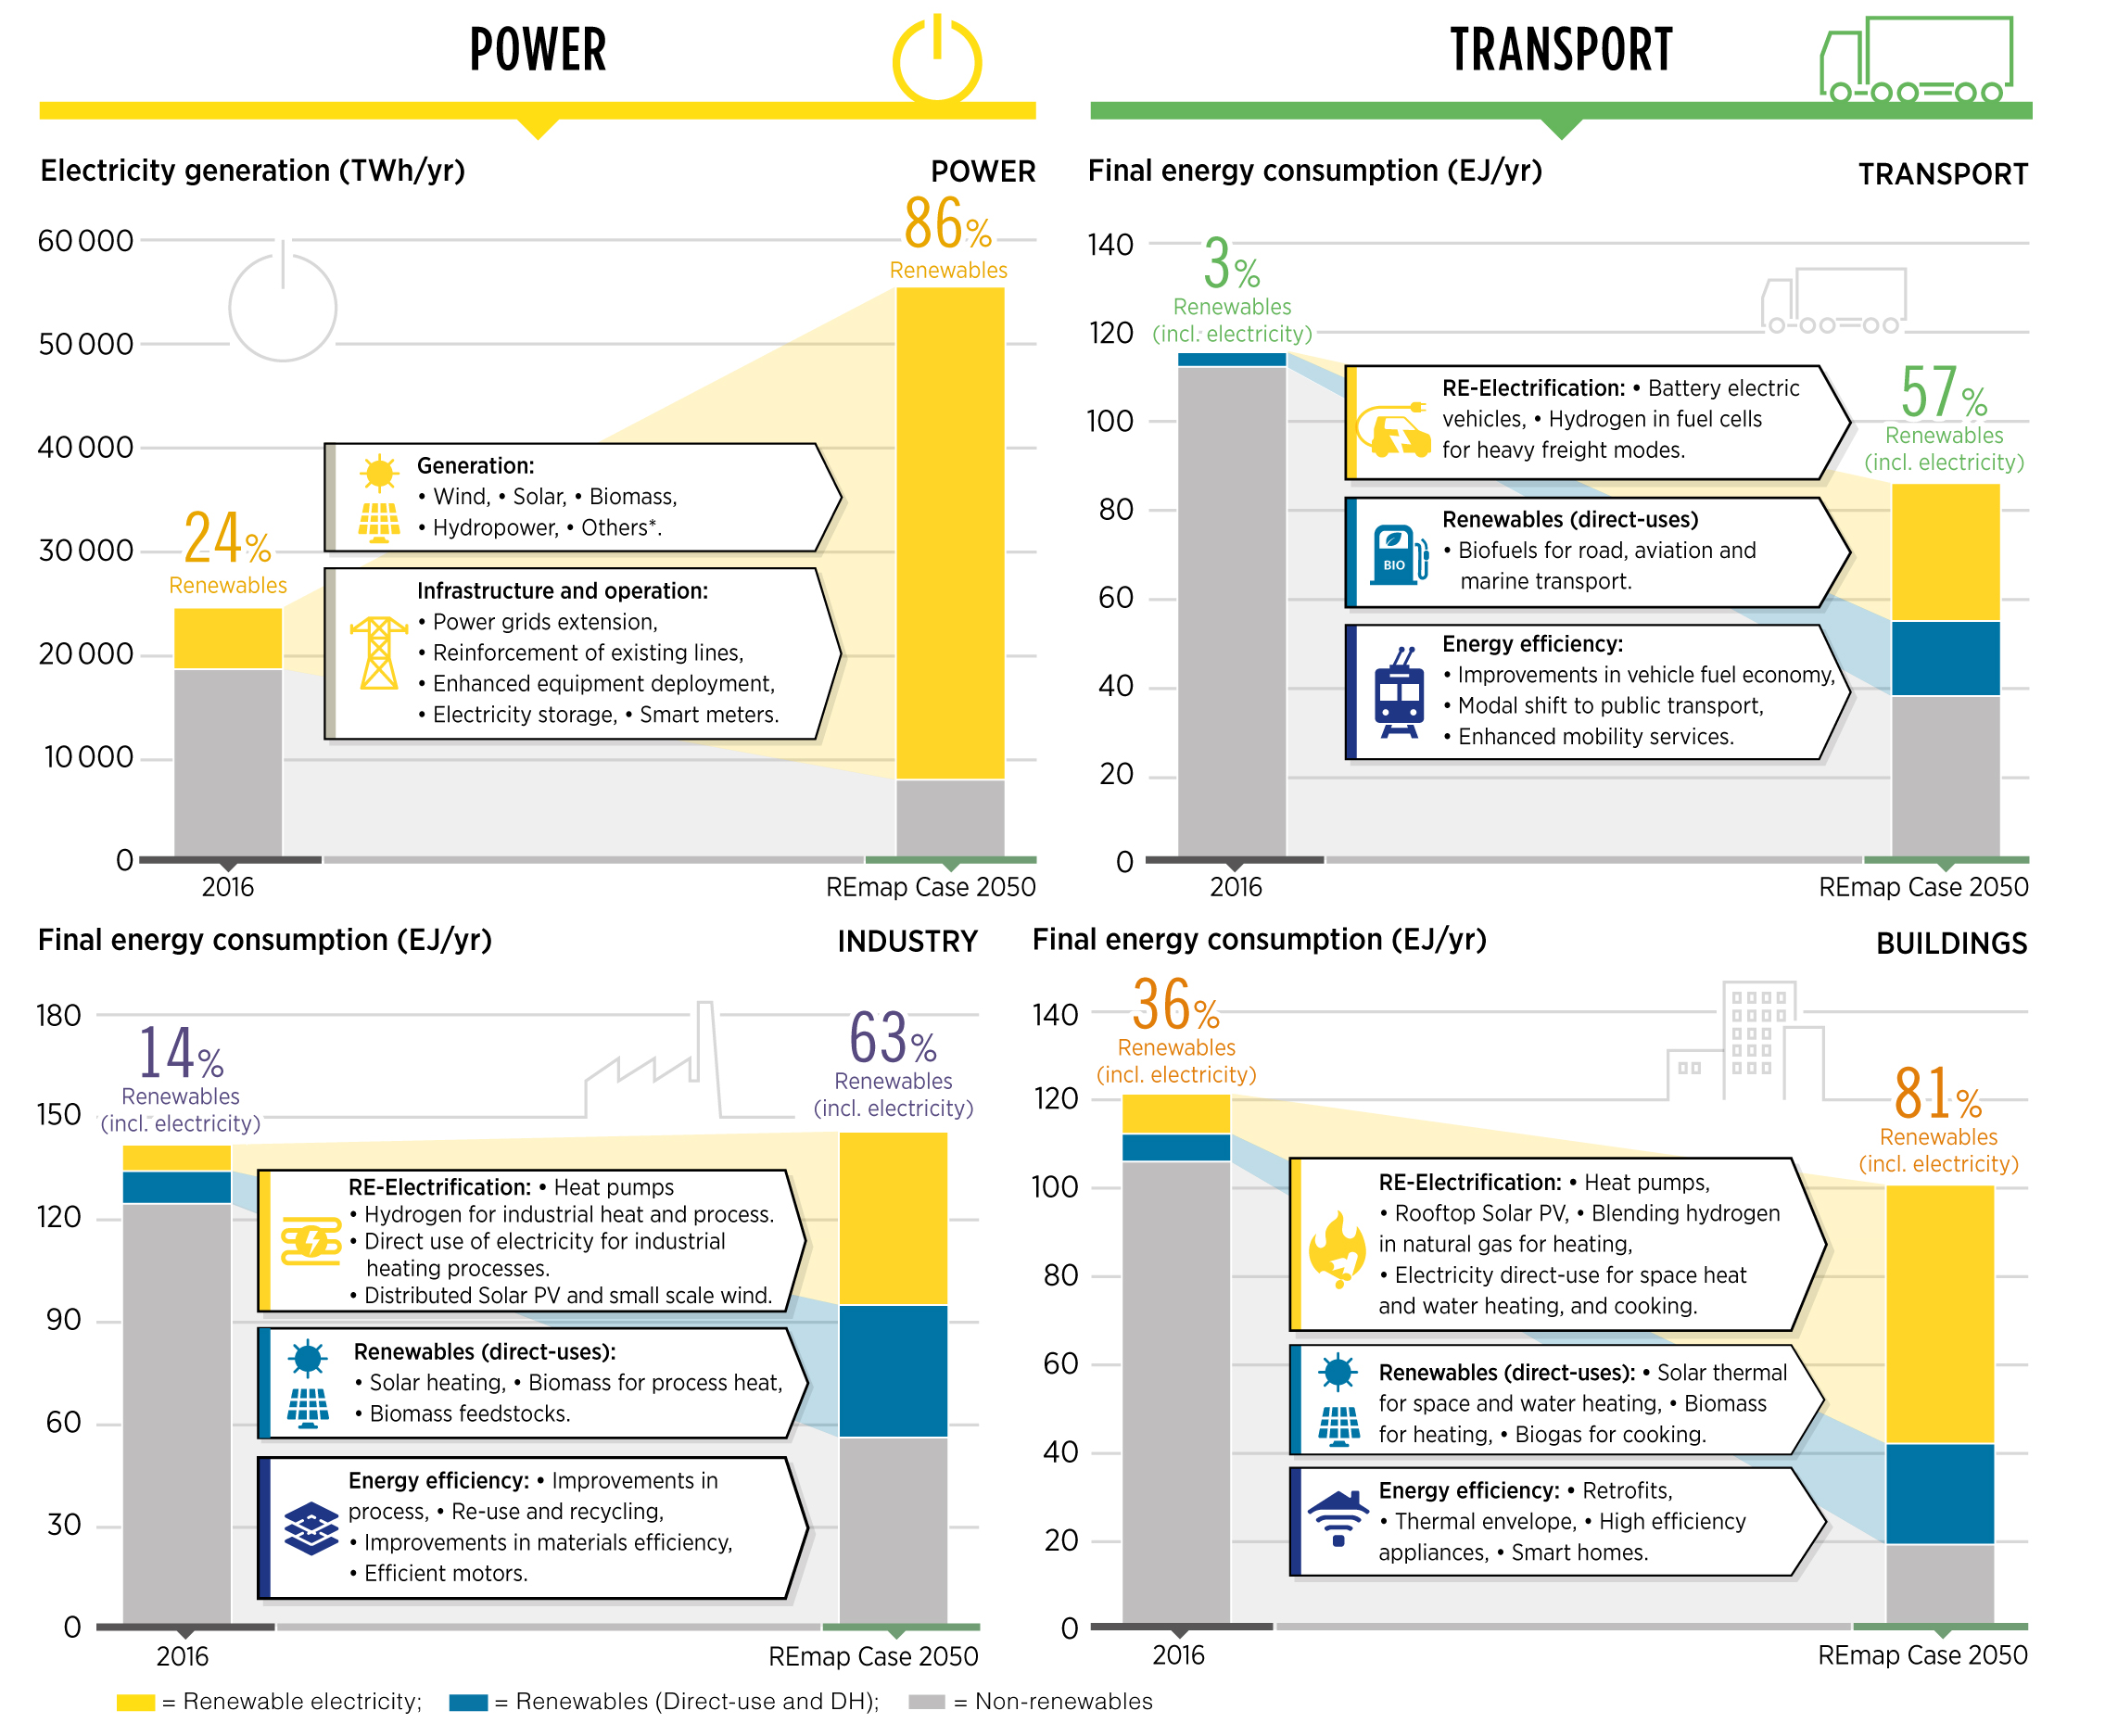
Fig. 9. Measures to accelerate the implementation of global and small-scale energy transition by economic sectors, TWh / h, EJ / year, 2016-2050. Source: IRENA report Global Energy Transformation: A Roadmap to 2050, April 2019.
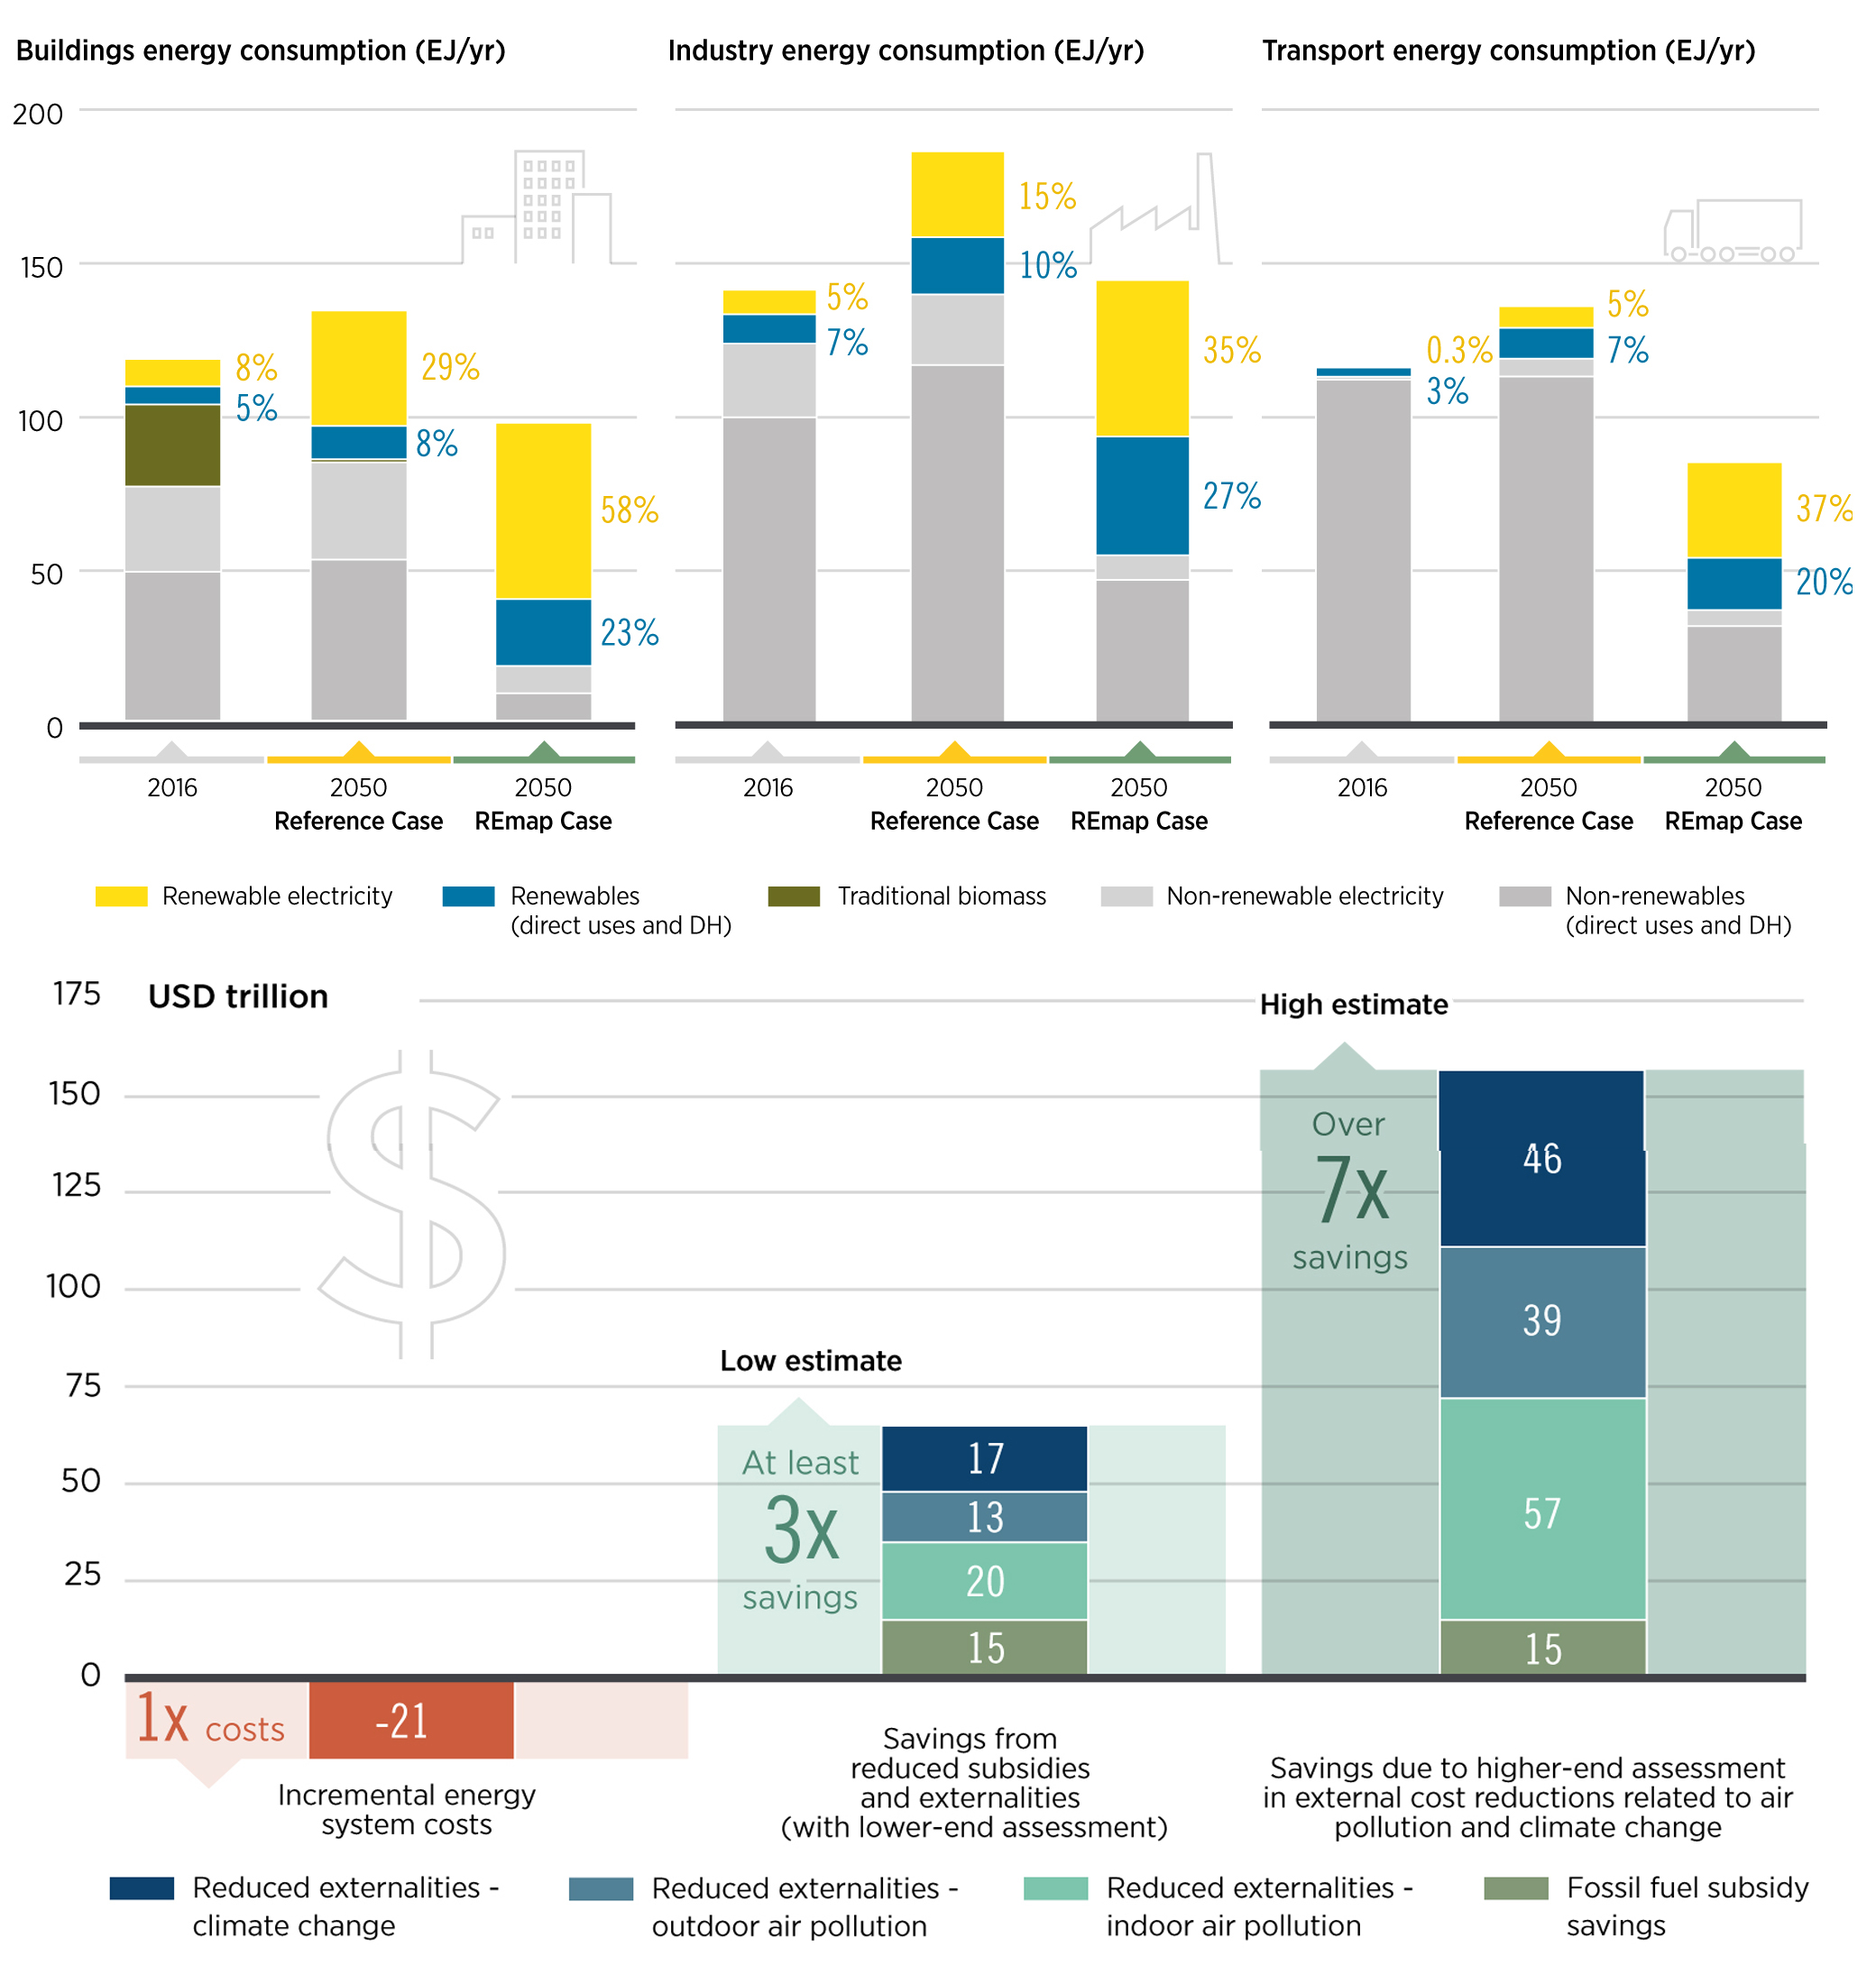
Fig. 10. Fossil and RES consumption in buildings, industry and transport; basic and accelerated scenarios, 2016 and 2050 (EJ/year). Financial benefits from accelerating energy transfer versus costs - reducing system costs (investment, operating costs), subsidy savings over the 2016-2050 period ($ trillion). Source: IRENA report Global Energy Transformation: A Roadmap to 2050, April 2019.
This, in turn, will be an incentive for the development of local power generation (including BIPV) and small distributed networks, in cities as well. The good news is that the cooling energy consumption peak is almost completely equal to the daily generation peak in PV plants, and therefore the energy requirements for air conditioning can be covered by the PV energy currently considered excess – PV-VRE overgrowth – and such as is currently thought to require compensators in the form of storage, dispatching and energy balancing devices.
Benefits of transformation
In parallel with the factors of increasing demand for electricity, there will be processes of technical improvement of consuming devices, energy efficiency improvements and more. The forecasts for the ways of solving the problems of large and partly small energy transition are shown in fig. 9.
The use of electricity from renewable energy sources is key to reducing energy-related CO2 emissions. Even moderate developments in the field of RES electrification lead to more than 70% emission reductions; 60% of emission reductions will be achieved through renewable energy sources and electrification of transport (private and public) and heat/cold generation in buildings.
But apart from environmental factors, there is a direct benefit from the aspirations for accelerated implementation of renewables and energy, see fig. 10. The slowdown in the transition to a new type of energy will become a considerable amount to humanity, measured in the hundreds of trillions US dollars.
Avenston actively promotes the development of renewable energy sources through development, construction and its own investment in the segment of commercial solar power plants. We have been designing and installing solar panels for more than 10 years. Our RES facilities operate throughout Ukraine.
Read more:
What does solar energy expect in 2019?
According to the analysis of previous reports on the results of 2018, solar energy has demonstrated itself in the best way among all types of RES, lending its development potential to the current year.
How to choose solar PV modules (solar panels)?
The solar panel is the most important and, at the same time, the most expensive component in any photovoltaic system. The successful and long-term profitable operation of the solar PV station largely depends on its reliability, durability and efficiency.
Сheap electricity by solar
The current prices for photovoltaic equipment (solar modules, inverters, etc.) and the climatic conditions of Ukraine make it possible to obtain cheap and environmentally friendly electricity using solar power plants.
Energy Generation Forecast for Solar Power Plants
Forecasts of future solar energy system output allows grid operators and utilities to proactively manage variable output, and thus integrating solar resources into the existing grid at lower costs to society.