Accelerating the green energy transition
Data on the development of the world’s energy, including renewable energy sources (RES), obtained in mid-2018, indicate that an important milestone has been reached – the installed power generation capacity from the sun and wind exceeds one terawat. The map of world energy has irrevocably changed. By the middle of the 21st century, the predominance of RES, primarily of the sun and wind, will become global.
The report, New Energy Outlook 2018, released mid-year by the Bloomberg New Energy Finance (BNEF) Analytical Center for the first half of 2018, shows tremendous numbers. The total installed and commissioned power generating energy from the sun and wind is already more than 1 terawatt (see Figure 1). Almost half of these capacities (46.5%) are solar PV stations, of which almost one third are small power plants, including domestic ones.
In order to reach the first fifth anniversary of the first solar power and power generating sunshine, $ 2.3 trillion in total was invested in the world (only $ 2.9 trillion in 2004 has been invested in RES). The second terawatt of generating power from the sun and wind will require much less time and money – this figure will be reached in 2025 on condition of investments amounting to somewhere 40% of the previous – $ 1.23 trillion.
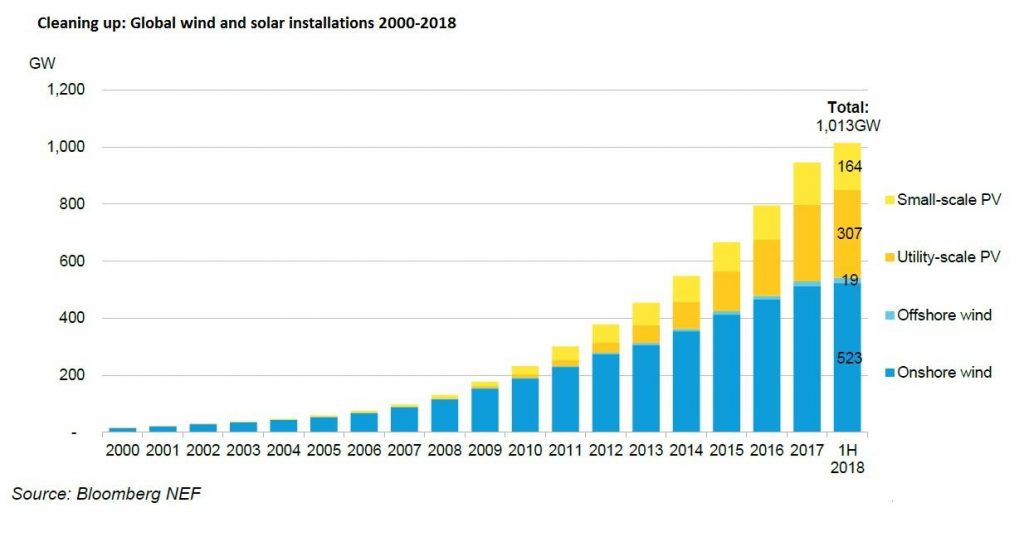
Fig. 1. Installed power of solar and wind power plants in the world, 2000-2018, Source: Bloomberg New Energy Finance, New Energy Outlook 2018.
More for less money
The tendency to reduce the cost and timing of construction of solar and wind power plants is explained by the cheapening of technologies and increasing their efficiency. It reflects the schedule of world investments in RES by 2017, adjusted according to data received by mid-2018, see pic. 2. Investments in RES continue to grow at a much lower pace than before, but for the same amount now it is possible to build much more actual capacity than even five years ago. Compare the figures: World investment in RES in 2016 amounted to $ 325 billion (which is 10% less than the investment in 2015), which added 138.5 GW to global power, which is 9% more than the growth in 2015 p. (~ 127.5 GW). In 2017, the RES was invested 7% less than in the year of record investments (2015, $ 360), but the installed capacity of RES from that time increased by almost a third. The power of solar and wind power stations has doubled in the last five years (since 2014). The average world expenses for the construction of each MW of power generating capacity for solar and wind power decreased by 20%. BNEF experts predict continuation of “bullish” trend – global investment in RES development will continue to grow, which is reflected in data for the first half of 2018.
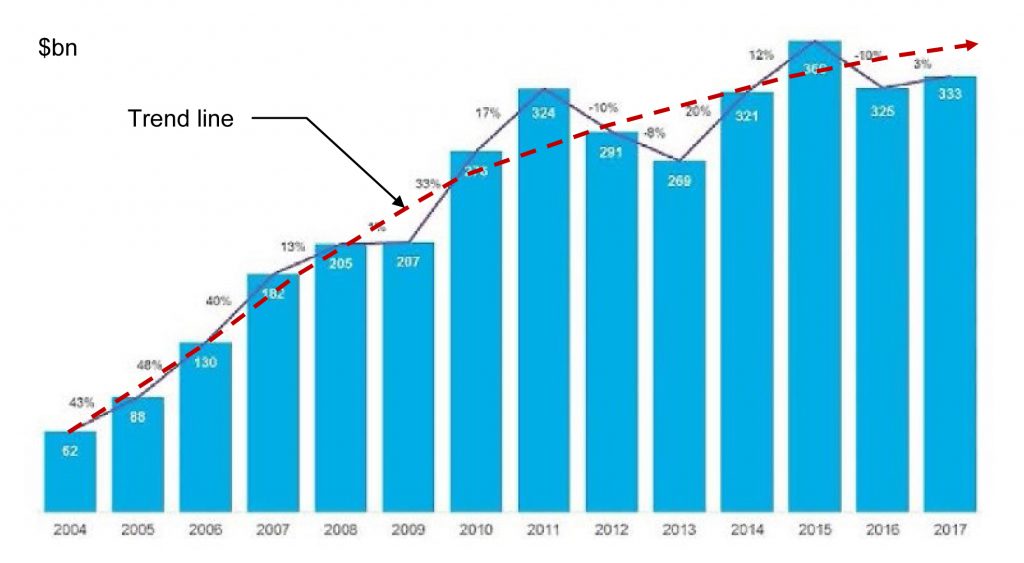
Fig. 2. Growth of new world investments in RES, 2004-2017, billion USD. Source: Bloomberg New Energy Finance, New Energy Outlook 2018.
Constant structural changes
The first teravatt of the solar-wind generation has become the point of an irreversible breakdown of the world-wide energy model. Over the next thirty years, until 2050, we expect a global shift to 2/3 of the energy derived from RES, as BNEF analysts say. Fig. 3. That is, the current model of consumption of 2/3 of energy from fossil sources is completely “overturned” on the contrary.
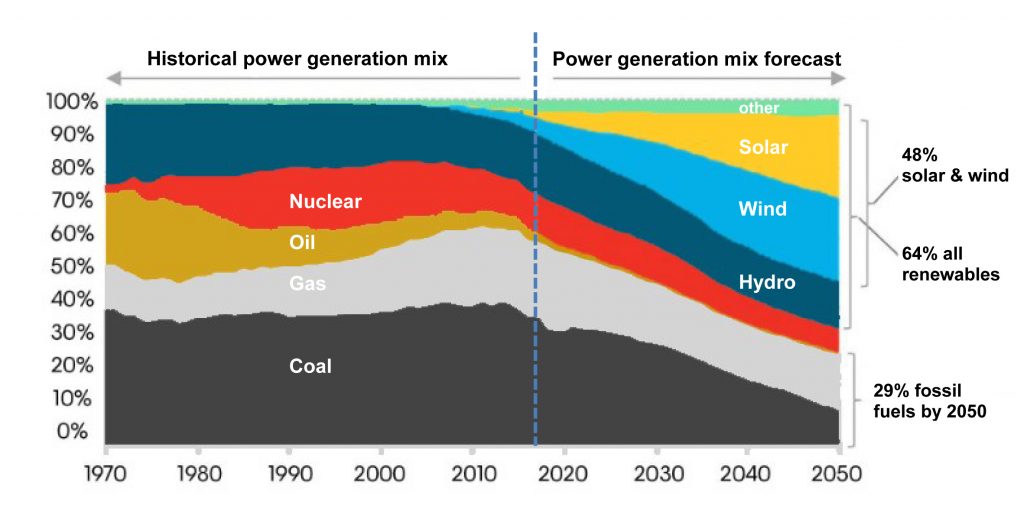
Fig. 3. Structure of World Energy - Current State and Forecast, 1970-2050. Source: Bloomberg New Energy Finance, New Energy Outlook 2018.
Such a global energy “transit” is conducive to a cheapening of the technology for the extraction and safe of renewable energy. By the way, the main technology of solar energy production – from crystalline silicon panels (c-Si) – will continue to reduce the cost, see Fig. 4
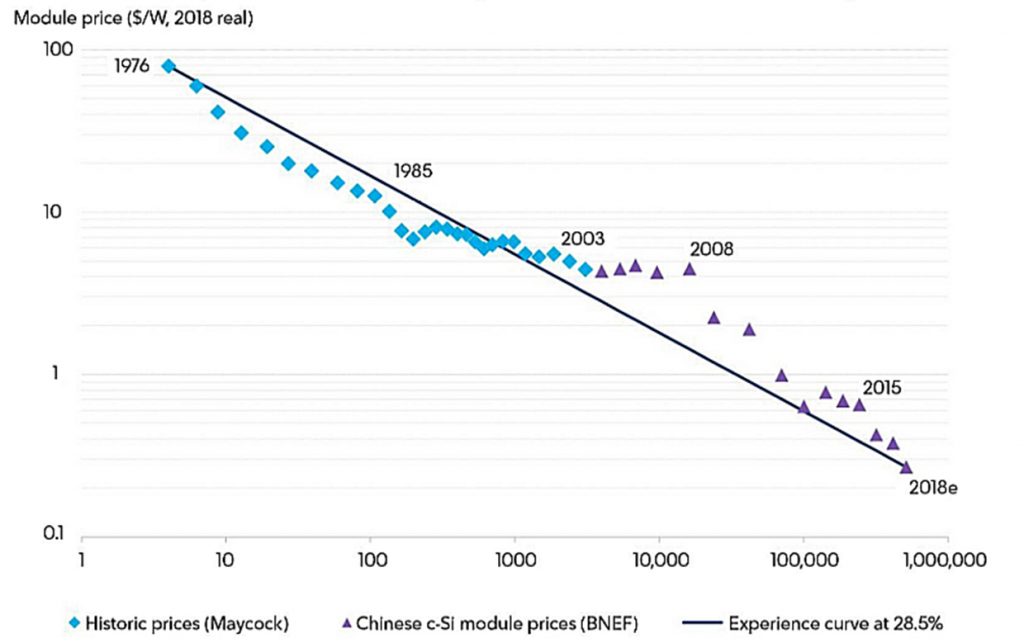
Fig. 4. World prices for crystalline PV-modules, 1976-2018 Source: Bloomberg New Energy Finance, New Energy Outlook 2018.
In fact, the achieved level of world wholesale prices for c-Si-plate at the end of the first half of 2018 is <0.2 $ / W. Currently, world prices for PV-modules are formed by China. By 2050, according to forecasts, the cost of PV-installation will fall at comparable prices by at least 71%, which prompts investors to invest more actively in PV-technology. However, the cost of wind energy will also decrease over time – by 58%. It will allow more active use of solar and wind generation in the tandem (PV-hybrid generation), which in some way offset the natural uneven generation of these two variable renewable sources (VREs).
The second trend, which leads to the overall acceptability of natural generation bursts from RES, is the further spread of stored energy storage technologies (ESS), especially this one which is received at small and home VRE generators. A powerful driver of this trend is the further cheaping of Li-ion drives. In fig. 5 it is shown BNEF expectations for 2025 and 2030 prices per kilowatt-hour battery capacity. Over the next ten years, the price for an ESS device for lithium-ion technology will decrease more than twice. It allows us to hope that such devices (especially for home, small and medium distributed generating capacities) can be used everywhere to eliminate unbalances in the common electricity grid.
Large, powerful ESSs will also be developed. Their total accumulation capacity will increase 6 times, and by 2050 it will make 15% of the total power of the world power grid. Rechargeable storage will occupy 44% of ESS, and this figure will increase. In 2050, almost 70% of all new ESS that will be put into exploitation are electric batteries. Cheap batteries allow you to use accumulated energy from wind and sunlight, when the wind is not blowing and the sun does not shine.
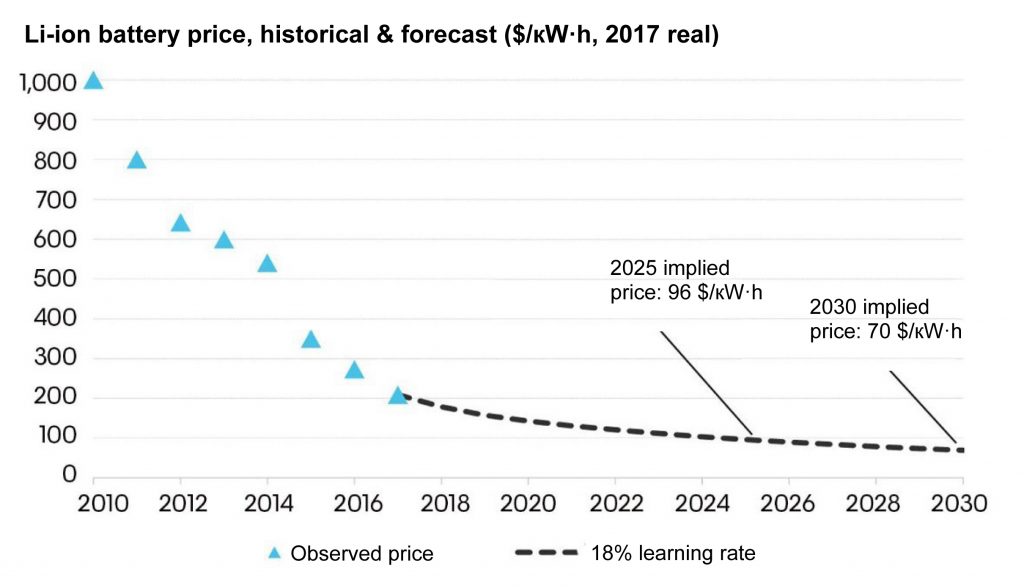
Fig. 5. World prices for Li-ion batteries, status and forecast, 2010-2030. Source: Bloomberg New Energy Finance, New Energy Outlook 2018.
Triple Impact
Until the middle of the century, the advance growth of solar generation will lead to a leveling in the application of solar and wind stations between each other – 50/50. They will form the basis of global electricity generation and will provide almost 50% of world electricity generation. Together with hydrogeneration, other types of RES, nuclear technology, the total hydrocarbon production will reach 71%.
The world’s largest use of coal, which in the structure of global generation will fall from the current 29% to less than 11%.
The global consumption of natural gas will increase slightly, despite the general increase in global demand for electricity. Gas in generating capacity will be mainly applied to fast compensation plants (eg gas turbines), which together with the ESS will share the daily and seasonal unevenness of the VRE generation and balance supply / demand bursts in the public grid.
A particularly significant reduction in gas consumption will take place after 2040 in Europe, but in China and India, on the contrary, the demand for gas will increase essentially.
The most noticeable “energy transit” will take place in Europe, where the whole energy structure will be based on variable (VRE) generation and use of ESS of different capacities and types. In general, in Europe in 2050, RES will generate 87% of all primary electricity. And in Germany, these changes will take place much earlier. In 2025, Germany plans to abandon nuclear power completely, with a 29% fall in electricity generation from fossil fuels (coal, oil, coal), and the use of RES will exceed 70%. According to BNEF, Germany by 2050 will generate 84% of electricity from RES, and the sun and wind in general in the energy structure of the country will occupy 74%.
The sun, wind and energy storage (ESS) together will become a “triple” impact that will change the global structure of energy generation.
Transformation of the World Energy Map
Changing in the global structure of power generation will require not only significant financing but also a reorientation of investment flows.
According to the report “New Energy Outlook 2018” in the new power generating capacity in the period from 2018 to 2050 will be invested $ 11.5 trillion in the world, of which solar and wind stations will be invested $ 8.4 trillion. Other technologies with zero emissions of greenhouse gases (mainly nuclear and hydro plants) and RES will be financed for the amount of $ 1.5 trillion.
In fig. 6 there are given the forecasts for 2050 on the distribution of world investments in new power generating capacities by region of the planet.
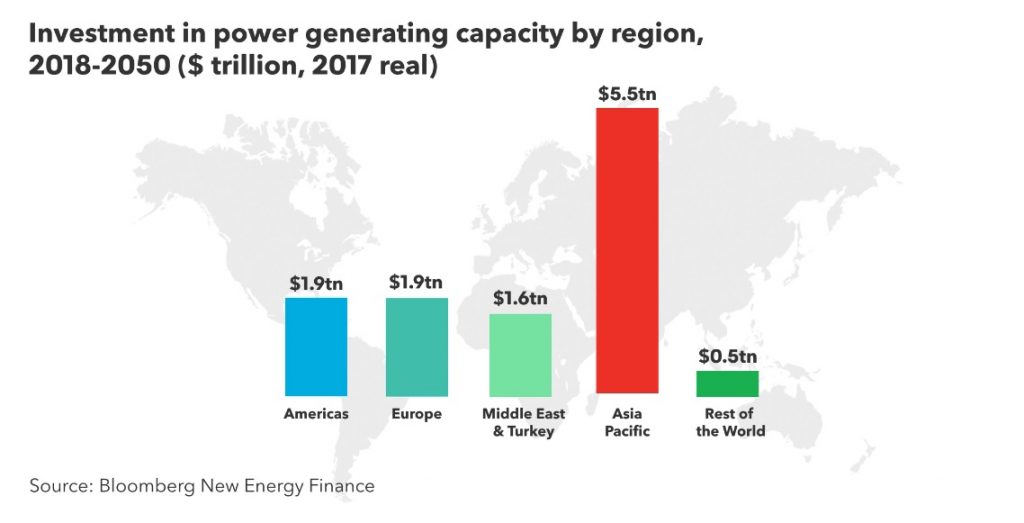
Fig. 6. Investments in the world power industry by regions from 2018 to 2050 (trillion USD). Source: Bloomberg New Energy Finance, New Energy Outlook 2018.
The Asia-Pacific region, which primarily includes China, India and Australia, will become the world leader in energy rebuilding. And this is already happening. Last year China added 53 GW to the world’s solar generation – it`s approximately the half of the world’s new installed solar power. Explosive character had the growth of investment in other parts of the planet. For example, Mexico has increased its investment in solar projects by 8.1 times, and the financing of solar power stations in the United Arab Emirates has increased by 30 times. The OAU, together with Japanese firms, has set an ambitious goal to build solar farms with a total capacity of 220 GW, which is equivalent to almost one-fifth of the total solar power capacity currently installed all over the world.
It definitely transforms the world power map. Проте домінувати до 2050 р. у використанні ВДЕ (і перш за все сонця та вітру) буде Європа, де частина ВДЕ становитиме 87% у виробітку первинної електроенергії. However, by 2050, the Europe will dominate by using of RES (and first of all the sun and wind), where part of the RES will be 87% of primary electricity generation. Further among the leaders without hydrocarbon transit – India (75%), China (62%), and the United States (55%).
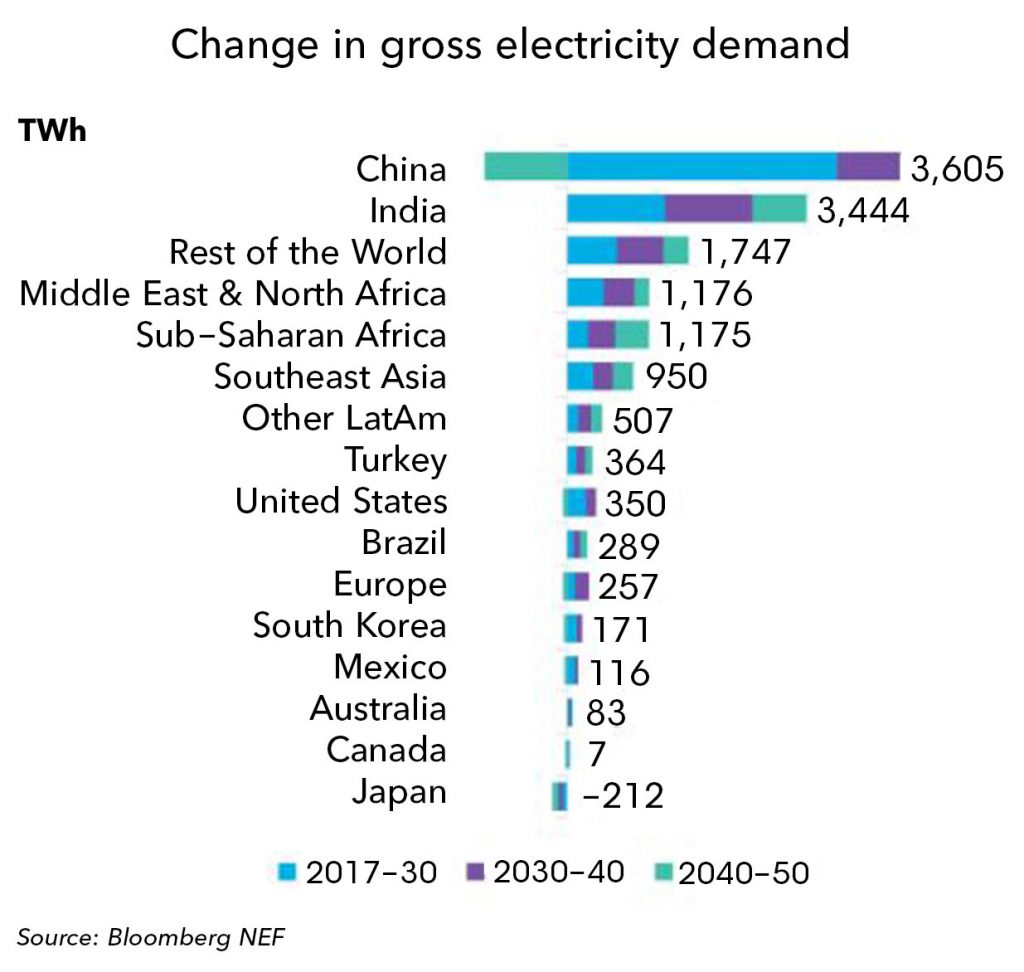
Fig. 7. Growth of global demand for electric power from 2017 to 2050, tvt · g. Source: Bloomberg New Energy Finance, New Energy Outlook 2018.
All these changes by 2050 will take place against the backdrop of a 57% increase in global demand for electricity. China and India will be the world’s centers of power generation, see. Fig. 7. BNEF predicts that global demand for electricity from 25,000 TWh recorded in 2017 will increase to 38.7 thousand TWh in 2050. The largest investments will require countries, such as Africa, the Middle East and South- Developing East Asia. In these regions, the number of people will continue to grow, but industrial development will also occur, which will be accompanied by an improvement in the living standards, and hence the growth of the use of electricity and consumer needs. Growth of GDP and increased access to electricity will lead to a doubling of demand.
On the contrary, in the developed countries of the Organization for Economic Cooperation and Development (OECD), it is expected that an increase in demand will be anemic or even begin to face the opposite factors that reduce overall electricity consumption. They combine the developed energy efficiency that will penetrate all life spheres without exception, relatively small pace of acceleration of economic development and a consistent abandonment of all energy-intensive industries.
The scenario of a global change in the energy structure takes into account the growth of electric vehicles. The BNEF agency predicts that by 2050, electric vehicles (EVs) will add to the total demand 3,461 TWh to the global total electricity demand. But it is expected that roughly half of this demand will be covered by additional generation from REE. In addition, the EVs will be charged by themselves at the time when there is an excess of energy from RES, primarily from solar energy.
So, the only conclusion from the BNEF report for investors is “Follow the sun!”
Read more:
Liquid Biofuels
There are 3 types of biofuels, depending on the state of aggregation and the nature of the substance: solid, liquid and gaseous. Liquid fuels are alcohols (methanol, ethanol, butanol), ethers, biodiesel and biomass oil.
Denmark provide $19 million to hydrogen production
The Danish government has announced the development of two renewables-powered energy storage projects, GreenLab P2X and HySynergy. The stored energy will be used as a fuel for buses, aircraft, and ships.
Bioenergy: Past, Present and Future
Bioenergy plays an important role in many low carbon development scenarios and can be particularly useful in long haul transport where alternative energy sources are not available. The expanded role of bioenergy is still under consideration, and sometimes disputes over the sustainability of production and use.
Solar energy: saving money and the planet
Solar energy has rapidly become a fundamental part of the global transition to sustainable development and clean energy and is emerging as one of the most promising solutions.